Download

1 / 13
140 likes | 270 Views
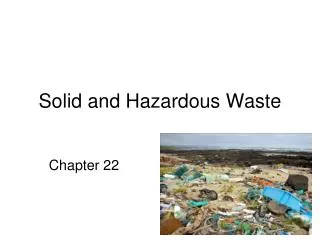
Solid waste projections The Future of Ireland‘s Environment 3 December 2008. Seán Lyons Economic and Social Research Institute Sean.Lyons@esri.ie. Outline. Introduction The ISus model Behavioural parameters Waste projections by type/sector Municipal Construction & demolition Hazardous

E N D
Solid waste projectionsThe Future of Ireland‘s Environment3 December 2008 Seán Lyons Economic and Social Research Institute Sean.Lyons@esri.ie
Outline • Introduction • The ISus model • Behavioural parameters • Waste projections by type/sector • Municipal • Construction & demolition • Hazardous • Industrial • Other • Conclusions
Introduction • ESRI developing a sustainable development research model, funded by the EPA’s STRIVE programme. • Ireland‘s Sustainable Development Model • Emissions and resource use up to 2025; alternative socio-economic & policy assump. • Currently predicts emissions of 45 substances from 19 sectors • Solid waste emissions divided by type (Hazardous, Biodegradable Municipal Waste, Other) and disposition (Recycled, Incinerated, Landfilled, Unknown)
Estimating behavioural parameters • Projecting future emissions: how will economic conditions and policy choices affect behaviour? • Some parameters based on Irish household or firm level data; others from international research • Key influences on waste emissions: • Demographics, Income / Output • Accessibility/prices of disposal and recycling options, other facilities
Behavioural parameters - 2 • Examples of waste parameters: • Elasticity of waste per household w.r.t. disposable income = +1.08 (forthcoming) • Avg change in waste per household due to weight-based charging: -45% (Scott & Watson, 2006) • Price elasticity of household mixed waste disposal, weight-based = -0.27(Scott & Watson, 2006) • Elasticity of household recycling with respect to mixed waste price = +0.22 (Fullerton & Kinnaman, 2000)
Municipal Solid Waste • Historical baseline: EPA National Waste Reports • Demand drivers: # households, household size, disposable income, service sector output • Prevalence of pay-by-weight and pay-by-volume charging; per unit charge where used • In progress: effects of collection arrangements, e.g. kerbside collection of recyclables, use of three-bin system, etc.
Projections for Biodegradable Municipal Waste Source: ESRI ISus model, based on 2008 ESRI Medium Term Review forecasts, credit crunch scenario; figures through 2006 are actuals
Construction and demolition waste • EPA National Waste Reports give aggregate C&D waste figures • Projections for future construction activity from HERMES • Parameters are available for waste arisings per area of new building, by type of construction (e.g. residential) • Model shows expected effects on construction waste of ongoing NDP spending and fall in housing construction
Projections for construction and demolition waste Source: ESRI ISus model, based on 2008 ESRI Medium Term Review forecasts, credit crunch scenario; 2006 figure is actual
Projections for hazardous waste Source: ESRI ISus model, based on 2008 ESRI Medium Term Review forecasts, credit crunch scenario; 2006 figure is actual
Other waste categories • Organic agricultural waste contributes most of the non-BMW, non-haz. category • Estimated at 60 million tonnes in 2004 • No longer tracked by EPA, because not defined as ‘waste’ in EU regulation • Mostly used to produce exports • Disposition of much waste remains unknown • Especially C&D & household waste • Over 3 million tonnes in 2006, excl. agriculture • Industrial waste is tracked in detail via IPPC licensing system • However, microdata only available for 2001/4/6 in electronic form
Conclusions • Big fall in C&D waste due to economic shift away from residential construction • Hazardous waste to follow similar pattern, but likely to recover mid next decade • Recession should slow or even halt growth in BMW for next couple of years, but EU targets from 2010 still hard to meet • Huge organic agricultural waste stream no longer reported officially • Other data gaps: MSW quantities, prices and services offered by collector/year; digitisation of historical AERs