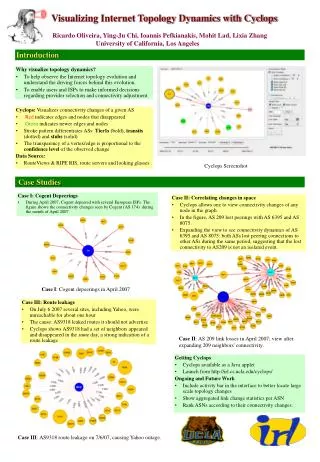
Download

1 / 58
580 likes | 680 Views
This work highlights the significance of high variability phenomena in Internet traffic dynamics and topology. It covers motivation, definitions, and examples of heavy-tailed distributions prevalent in Internet usage. Key mathematical results are presented, showcasing the resilience to ambiguity found in various Internet metrics like bandwidth, file sizes, and latency. The research emphasizes the implications of these heavy-tailed distributions on risk modeling, load balancing, and complex system studies, while also clarifying the approach to handle high variability in Internet systems.

E N D
On Internet Traffic Dynamics and Internet Topology IHigh Variability Phenomena Walter Willinger AT&T Labs-Research walter@research.att.com [This is joint work with J. Doyle and D. Alderson (Caltech)]
Topics Covered • Motivation • A working definition • Some illustrative examples • Some simple constructions • Some key mathematical results • Resilience to ambiguity • Heavy tails and statistics • A word of caution
Motivation • Internet is full of “high variability” • Link bandwidth: Kbps – Gbps • File sizes: a few bytes – Mega/Gigabytes • Flows: a few packets – 100,000+ packets • In/out-degree (Web graph): 1 – 100,000+ • Delay: Milliseconds – seconds and beyond • How to deal with “high variability” • High variability = large, but finite variance • High variability = infinite variance
A Working Definition • A distribution function F(x) or random variable X is called heavy-tailed if for some >0 where c>0 and finite • F is also called a power law or scaling distribution • The parameter is called the tail index • 1< < 2, F has infinite variance, but finite mean • 0 < < 1, the variance and mean of F are infinite • “Mild” vs “wild” (Mandelbrot): 2 vs < 2
Some Illustrative Examples • Some commonly-used plotting techniques • Probability density functions (pdf) • Cumulative distribution functions (CDF) • Complementary CDF (CCDF) • Different plots emphasize different features • Main body of the distribution vs. tail • Variability vs. concentration • Uni- vs. multi-modal
2 10 Technological ($10B) Natural ($100B) Most events are small 1 10 US Power outages (10M of customers) But the large events are huge 0 10 -2 -1 0 10 10 10 20th Century’s 100 largest disasters worldwide Log(rank) Log(size)
Why “Heavy Tails” Matter … • Risk modeling (insurance) • Load balancing (CPU, network) • Job scheduling (Web server design) • Combinatorial search (Restart methods) • Complex systems studies (SOC vs. HOT) • Towards a theory for the Internet …
Some First Properties • Heavy-tailed or “scaling” distribution • Compare to exponential distribution: • Linearly increasing mean residual lifetime • Compare to exponential distribution
Some Simple Constructions • For U uniform in [0,1], set X=1/U • X is heavy-tailed with =1 • For E (standard) exponential, set X=exp(E) • X is heavy-tailed with =1 • The mixture of exponential distributions with parameter 1/ having a (centered) Gamma(a,b) distribution is a Pareto distribution with =a • The distribution of the time between consecutive visits of a symmetric random walk to zero is heavy-tailed with =1/2
Key Mathematical Properties of Scaling Distributions • Invariant under aggregation • Non-classical CLT and stable laws • (Essentially) invariant under maximization • Domain of attraction of Frechet distribution • (Essentially) invariant under mixture • Example: The largest disasters worldwide
Linear Aggregation: Classical Central Limit Theorem • A well-known result • X(1), X(2), … independent and identically distributed random variables with distribution function F (mean and variance 1) • S(n) = X(1)+X(2)+…+X(n) n-th partial sum • More general formulations are possible • Often-used argument for the ubiquity of the normal distribution
Linear Aggregation: Non-classical Central Limit Theorem • A not so well-known result • X(1), X(2), … independent and identically distributed with common distribution function F that is heavy-tailed with 1<<2 • S(n) = X(1)+X(2)+…+X(n) n-th partial sum • The limit distribution is heavy-tailed with index • More general formulations are possible • Rarely taught in most Stats/Probability courses!
Maximization:Maximum Domain of Attraction • A not so well-known result (extreme-value theory) • X(1), X(2), … independent and identically distributed with common distribution function F that is heavy-tailed with 1<<2 • M(n)=max(X(1), …, X(n)), n-th successive maxima • G is the Fréchet distribution • G is heavy-tailed with index
Intuition for “Mild” vs. “Wild” • The case of “mild” distributions • “Evenness” – large values of S(n) occur as a consequence of many of the X(i)’s being large • The contribution of each X(i), even of the largest, is negligible compared to the sum • The case of “wild” distributions • “Concentration” – large values of S(n) or M(n) occur as a consequence of a single large X(i) • The largest X(i) is dominant compared to S(n)
Weighted Mixture • A little known result • X(1), X(2), … independent and identically distributed with common distribution function F that is heavy-tailed with 1<<2 • p(1), p(2), …, p(n) iid in [0,1] with p(1)+…p(n)=1 • W(n)=p(1)X(1)+…+p(n)X(n) • Invariant “distributions” are • Condition on X(i) >a>0
Slope = -1 (=1) 20th Century’s 100 largest disasters worldwide 2 10 Technological ($10B) Natural ($100B) 1 10 US Power outages (10M of customers, 1985-1997) 0 10 -2 -1 0 10 10 10
2 US Power outages (10M of customers, 1985-1997) 10 Slope = -1 (=1) 1 10 8/14/03 0 10 A large event is not inconsistent with statistics. -2 -1 0 10 10 10
Resilience to Ambiguity • Scaling distributions are robust under • … aggregation, maximization, and mixture • … differences in observing/reporting/accounting • … varying environments, time periods • The “value” of robustness • Discoveries are easier/faster • Properties can be established more accurately • Findings are not sensitive to the details of the data gathering process
On the Ubiquity of Heavy Tails • Heavy-tailed distributions are attractors for averaging (e.g., non-classical CLT), but are the only distributions that are also (essentially) invariant under maximizing and mixing. • Gaussians (“normal”) distributions are also attractors for averaging (e.g., classical CLT), but are not invariant under maximizing and mixing • This makes heavy tails more ubiquitous than Gaussians, so no “special” explanations should be required …
Heavy Tails and Statistics • The traditional “curve-fitting” approach • “Curve-fitting” by example • Beyond “curve-fitting” – “Borrowing strength” • “Borrowing strength” by example • What “science” in “scientific modeling”? • Additional considerations
“Curve-fitting” approach • Model selection • Choose parametric family of distributions • Parameter estimation • Take a strictly static view of data • Assume moment estimates exist/converge • Model validation • Select “best-fitting” model • Rely on some “goodness-of-fit” criteria/metrics • “Black box-type” modeling, “data-fitting” exercise
“Curve-fitting” by example • Randomly picked data set • LBL’s WAN traffic (in- and outbound) • 1:30, June 24 – 1:30, June 25 (PDT), 1996 • 243,092 HTTP connection sizes (bytes) • Courtesy of Vern Paxson (thanks!) • Illustration of widely-accepted approach
HTTP Connections (Sizes) 0 -1 -2 log10(1-F(x)) -3 -4 -5 -6 0 1 2 3 4 5 6 7 8 log10(x) CCDF plot on log-log scale
HTTP Connections (Sizes) 0 -1 -2 -3 log10(1-F(x)) -4 -5 -6 0 1 2 3 4 5 6 7 8 log10(x) Fitted 2-parameter Lognormal distribution (=6.75,=2.05)
HTTP Connections (Sizes) 0 -1 -2 log10(1-F(x)) -3 -4 -5 -6 0 1 2 3 4 5 6 7 8 log10(x) Fitted 2-parameter Pareto distribution (=1.27, m=2000)
The “truth” about “curve-fitting” • Highly predictable outcome • Always doable, no surprises • Cause for endless discussions (“Which model is better?”) • When “more” means “better” … • 2-parameter distributions (Pareto, Lognormal, …) • 3-parameter distributions (Weibull, Gamma, …) • 5-parameter distribution (Double-Pareto, -Lognormal, …), etc. • Inadequate “goodness-of-fit” criteria due to • Voluminous data sets • Data with strong dependencies (LRD) • Data with high variability (heavy tails) • Data with non-stationary features
“Borrowing strength” approach • Mandelbrot & Tukey to the rescue • Sequential moment plots (Mandelbrot) • Borrowing strength from large data (Tukey) • “Borrowing strength” – dynamic view of data • Rely on traditional approach for initial (small) subset of available data • Consider successively larger subsets • Look out for inherently consistent models • Identify “patchwork “ of “fixes”
HTTP Connections (Sizes) 0 -1 -2 -3 log10(1-F(x)) -4 -5 -6 0 1 2 3 4 5 6 7 8 log10(x) Lognormal?
HTTP Connections (Sizes) 0 -1 -2 log10(1-F(x)) -3 -4 -5 -6 0 1 2 3 4 5 6 7 8 log10(x) Pareto?
“Borrowing strength” (example 1) • Use same data set as before • Illustration of Mandelbrot-Tukey approach (1) • Sequential standard deviation plots • Lack of robustness • A case against Lognormal distributions • More on sequential standard deviation plots • Scaling distributions to the rescue
The lognormal model assumes existence/convergence of 2nd moment parameter estimates are inherently consistent However, sequential std plot indicates non-existence/divergence of 2nd moment inherently inconsistent parameter estimates What “science” in “scientific modeling”? Curve/data fitting is not “science” “Patchwork” of “fixes” (Mandelbrot) The case against lognormal
HTTP Connections (Sizes) 0 -1 -2 log10(1-F(x)) -3 -4 -5 -6 0 1 2 3 4 5 6 7 8 log10(x) Pareto?
“Borrowing strength” (example 2) • Use same data set as before • Illustration of Mandelbrot-Tukey approach (2) • Sequential tail index plots • Strong robustness properties • A case for scaling distributions • A requirement for future empirical studies
The case for scaling distributions • The “creativity” of scaling distributions • Data: Divergent sequential moment plots • Mathematics: Allow for infinite moments • Re-discover the “science” in “scientific modeling” • Scientifically “economical” modeling (when more data doesn’t mean more parameters) • Statistically “efficient” modeling (when more data mean more model accuracy/confidence) • Trading “goodness-of-fit” for “robustness”