Download
1 / 33
340 likes | 690 Views
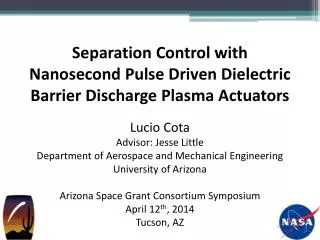
Reduction of VOC Emissions from Paint-Booth Operations Using Dielectric Barrier Discharge 30 th Environmental and Energy Symposium & Exhibition San Diego, CA April 7, 2004 Gregory D. Holland John N. Veenstra Arland H. Johannes Gary L. Foutch Freddie Hall. Background

E N D
Reduction of VOC Emissions from Paint-Booth Operations Using Dielectric Barrier Discharge 30th Environmental and Energy Symposium & Exhibition San Diego, CA April 7, 2004 Gregory D. Holland John N. Veenstra Arland H. Johannes Gary L. Foutch Freddie Hall
Background • The Oklahoma City Air Logistics Center (OC-ALC) conducts surface coating as regulated by 40 CFR 63.741 in maintenance paint booths at the facility. Volatile Organic Compounds (VOCs) are emitted as a result. While the emissions rate is currently well below the stationary major source threshold of 10 tons per year, these low emissions are the result of using low-VOC/low-solids paints.
Background • The low-VOC/low-solids paint has performed and weathered poorly, and as a result, the planes require more frequent painting as well as constant touch-ups. An efficient method of emission treatment is desired to enable renewed use of the better performing high-VOC/high-solids paints.
Background • The typical emissions control technique for surface coating spray booths is carbon absorption (average control efficiency = 90%). Carbon absorption has a fire potential in the carbon bed when high concentrations of ketones and alcohols are present as at TAFB. Furthermore, the painting operations at TAFB are not continuous but are of short duration. Due to this operational pattern, a technology with an “instant-on”, ”instant off” capability without a concurrent step-up in emissions would be the most efficient treatment for TAFB.
Background • TAFB has commissioned the investigation of an innovative technology to meet plant and regulatory requirements. A Gas Phase Corona Reactor (GPCR), also known as a dielectric barrier discharge (DBD) or non-thermal plasma (NTP) reactor, is being designed to reduce VOC emissions from painting operations.
Project Goals • Establish optimum operating conditions using bench-scale studies. • Test capacity limits for design and cost of full-scale equipment. • Collect statistically significant data to verify VOC destruction and determine operating costs. • Two week operation test at Tinker AFB with greater than 90% removal of VOCs from stack exhaust.
Project Phases • Phase I: Investigate operation of different reactor geometries. Verify destruction capabilities. Investigate operating variables using single-tube, bench-scale reactors. • Phase II: Design pilot-scale reactor for 1,000 scfm (multi-tube design) and demonstrate unit at TAFB. Develop technology demonstration plan. • Phase III: Test 1,000 scfm unit. Determine economic and scale-up factors for the plasma unit. Design full-scale reactor for 20,000 cfm.
Plasma Discharge Process • High electric fields are used to generate high energy electrons (up to 10 eV) which collide with the gas molecules to create highly reactive ions and/or free-radicals. • The dielectric barrier prevents the direct flow of current and prevents excess heating. • Essentially no warm-up period required, allowing “instant on” capability. • “On-the-fly” adjustment of power to handle variation in VOC loading
Phase I • Investigate operation of different reactor geometries. • Verify destruction capabilities. • Investigate operating variables using single plasma zone, bench-scale reactors.
Target components: Toluene Methyl Isobutyl Ketone Butyl Acetate Sec-Butyl Alcohol Methyl Propyl Ketone Ethyl 3-Ethoxypropionate 1,6-Hexamethylene Diisocyanate Gas Mixture Actual Stack Gas Operating variables: Reactor geometry Round, square, plate Electric field strength 16-18 kV Discharge frequency 200-400 Hz Residence time 0.05-0.2 seconds VOC concentration 35-250 ppm Humidity 0-80% relative humidity
Figure 3. Plot of destruction data (as concentration) for V” = 17 kVrms, f = 300 Hz, tres = 0.1 second, and rh = 0% (Run #04).
Figure 4. Plot of destruction data (as a fraction of inlet conc.) for V” = 17 kVrms, f = 300 Hz, tres = 0.2 second, and rh = 70-80% (Run #40).
Phase I Results • Reactor geometry: Single dielectric barrier, annular gap. • Electric field strength: Greater destruction at higher electric field strengths. • Discharge frequency: Greater destruction at higher discharge frequencies. • Residence time: Greater destruction efficiency at higher residence times. • VOC concentration: Greater destruction efficiency at higher concentrations. • Humidity: Improves destruction efficiency of some components, reduces destruction efficiency of others. Humid conditions improve overall destruction efficiency. May increase energy requirements.
Phase II • Design pilot-scale reactor for treating 1,000 cfm (multi-tube design) and demonstrate unit at TAFB. • Determine economic and scale-up factors for the plasma unit. • Develop technology demonstration plan.
Phase II – Current Status • Comparing energy consumption parameters of different size reactors to determine scaling factors: • Single-tube reactor with a 1 to 50 cm plasma zone. • 10-tube reactors with 1-cm or 5-cm plasma zones in each tube. • Difficulties measuring the secondary current – require customized circuitry. • Economics will depend on energy requirements and final size.
Acknowledgments • Oklahoma City – Air Logistics Center • Center for Aircraft and Systems/Support Infrastructure
Acknowledgments • Vijay Kalpathi – Ph.D. student, Chemical Engineering • Visalakshi Annamalai – M.S. student, Electrical Engineering • Rajbarath.P – M.S. student, Environmental Engineering • Elangovan Karuppasamy – M.S. student, Environmental Engineering
Table 1. Summary of destruction data for residence time comparisons.
Table 2. Summary of destruction data for line operating frequency comparisons.
Table 3. Summary of destruction data for applied electric potential comparisons.
Table 4. Summary of destruction data for VOC concentration comparisons.
Table 5. Summary of destruction data for relative humidity comparisons.