Download
1 / 1
10 likes | 103 Views
Investigating polarisation signals of oceanic planets during high amplification microlensing. Explores specular reflection and detection of lower mass planets. Methods, results, and implications discussed for future observation techniques.

E N D
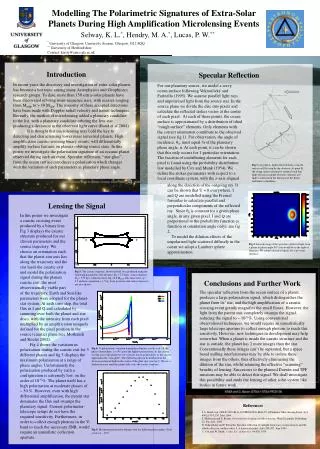
Modelling The Polarimetric Signatures of Extra-Solar Planets During High Amplification Microlensing Events Selway, K. L.*, Hendry, M. A.*, Lucas, P. W.** * University of Glasgow, University Avenue, Glasgow, G12 8QQ ** University of Hertfordshire Contact: kirsty@astro.gla.ac.uk Introduction Specular Reflection In recent years the discovery and investigation of extra-solar planets has become a hot topic among many Astrophysics and Geophysics research groups. To date, more than 150 extra-solar planets have been discovered orbiting main-sequence stars, with masses ranging from MNEP to > 10 MJUP. The majority of these accepted detections have been made with Doppler radial velocity and transit techniques. Recently, the method of microlensing added a planetary candidate to the list, with a planetary candidate orbiting the lens star producing a deviation in the observed light curve (Bond et al 2004). It is thought that microlensing may hold the key to detecting and characterising lower mass terrestrial planets. High amplification caustic-crossing binary events, will differentially amplify surface features on planets orbiting source stars. In this poster we investigate the polarisation signature of an oceanic planet observed during such an event. Specular reflection, “star-glint”, from the ocean surface introduces a polarisation which changes with the variation of such parameters as planetary phase angle. For our planetary source, we model a wavy ocean surface following Vokroulický and Farinella (1995). We assume parallel light rays and unpolarised light from the source star. In the source plane we divide the disc into pixels and calculate the reflected stokes vector at the centre of each pixel. At each of these points, the ocean surface is approximated by a distribution of tilted “rough surface” elements. Only elements with the correct orientation contribute to the observed signal (see fig 1). For observation, the angle of incidence, θ0, must equal ½ of the planetary phase angle, α. At each point, it can be shown that this only occurs for 1 particular orientation. The fraction of contributing elements for each pixel is found using the probability distribution law modelled by Cox and Munk (1954). We define the stokes parameters with respect to a local coordinate system, with the z-axis aligned Fig 1: At point A, light reflected from a smooth surface will be seen by the observer. At point B, the rough surface element is oriented such that light will not reach the observer, whereas at C light is reflected in the direction of the Earth and hence contributes. along the direction of the outgoing ray. It can be shown that U = 0 everywhere. I and Q are modelled using the Fresnel formulae to calculate parallel and perpendicular components of the reflected ray. Since θ0 is constant for a given phase angle, in any given pixel, I and Q are proportional to the probability function (a function of orientation angle only), see fig 2. To model the dilution effects of the unpolarised light scattered diffusely in the ocean we adopt a Lambert sphere approximation Lensing the Signal In this poster we investigate a caustic crossing event produced by a binary lens. Fig 3 displays the caustic structure produced for our chosen parameters and the source trajectory. We choose an orientation such that the planet-star axis lies along the trajectory and the star leads the caustic exit and model the polarisation signal during the planets caustic exit, the most observationally viable part < Fig 2: Intensity map of the speculary reflected light from a planet at phase angle 90° (star would be to the right of diagram). We adopt refractive indices for a air-water interface. Fig 3: The caustic structure, shown in bold, was produced using the following parameters: lens distance, DL = 5.14 kpc, source distance, DS = 7.53 kpc, total lens mass, ML =0.6 MSUN, lens mass ratio, q = 0.5 and lens separation = 1.5 θE. Lens positions and source trajectory are also shown. Conclusions and Further Work The specular reflection from the ocean surface of a planet, produces a large polarisation signal, which distinguishes the planet from its’ star, and the high amplification of a caustic crossing event greatly magnifies the small fluxes. However, the light from the parent star, completely swamps the signal, reducing the signal to ~ 10-8 %. Using conventional observational techniques, we would require an unrealistically large telescope aperture to collect enough photons to reach this sensitivity. However, new techniques in development may help somewhat. When a planet is inside the caustic structure and the star is outside, the planet has 2 more images than the star. Conventionally these images can’t be separated, but a space based nulling interferometer may be able to isolate these images from the others, thus effectively eliminating the dilution of the star, whilst retaining the effective “scanning” benefits of lensing. Successors to the planned Darwin and TPF missions may be able to detect this signal. We shall investigate this possibility and study the lensing of other solar-system like bodies in future work. of the trajectory. Earth and Sun-like parameters were adopted for the planet-star system. At each time step, the total flux in I and Q and calculated by summing over both the planet and star discs, with the intensity from each pixel multiplied by an amplification uniquely defined for the pixel position in the source (caustic) plane (see Mollerach and Roulet 2002). Fig 4 shows the variation in polarisation during the caustic exit for 3 different phases and fig 5 displays the maximum polarisation at a range of phase angles. Unfortunately the polarisation produced by such a configuration is extremely low, on the order of 10-8 %. The planet itself has a high polarisation at moderate phases of ~ 50 %. However, even with high differential amplification, the parent star dominates the flux and swamps the planetary signal. Current polarimeter-telescope setups do not have the required sensitivity. Furthermore, in order to collect enough photons in the V-band to reach the necessary SNR, would require an unrealistic collection aperture. Fig 4: % polarisation, variation during the planetary caustic exit. Of the phases shown here, α = 90° gives the highest polarisation. As the caustic sweeps across the planet we see a steady rise in polarisation as the caustic approaches the “star-glint”. The following dip can be attributed to the decrease polarised light in the centre of the glint spot (see fig 2). We see a further increase until the planet fully exits the caustic structure. References I. A. Bond et al. OGLE 2003-BLG-235/MOA 2003-BLG-53: A Planetary Microlensing Event. ApJ, 606:L155-L158, May 2004 S. Mollerach and E. Roulet. Gravitational Lensing and Microlensing. World Scientific Publishing Co. Pte. Ltd., 2002 D. Vokroulický and P. Farinella. Specular reflection of sunlight from wavy ocean surfaces and the albedo effect on satellite orbits. I. A statistical model. A&A,298:307, June 1995 C. Cox and W. Munk. J. Opt. Soc. of America, 44:838, 1954 Fig 5: Maximum polarisation during event for different phase angles. Peak occurs at ~ 110°.