Recipe Analysis
Recipe Analysis. Wisconsin Department of Public Instruction School Nutrition Team Summer 2011. RECIPE ANALYSIS. Determine what a serving of a recipe contributes towards meeting the food-based menu planning requirements. RECIPE ANALYSIS. Applies to: Your School Recipes

Recipe Analysis
E N D
Presentation Transcript
Recipe Analysis Wisconsin Department of Public Instruction School Nutrition Team Summer2011
RECIPE ANALYSIS Determine what a serving of a recipe contributes towards meeting the food-based menu planning requirements
RECIPE ANALYSIS Applies to: • Your School Recipes • USDA Quantity Recipes • Older versions (prior to April 2006) • Variations such as omitting ingredients or using alternate ingredients that contribute to meal pattern
Focus • Calculating contribution a serving of standardized recipe makes towards meeting menu planning system using yield information and Appendix A of USDA’s Food Buying Guide • Standardization process and how it relates to recipe analysis • Making substitutions in recipes using WI processed commodities products and converting to As Purchased units as part of standardization process
Recipe Analysis Class Organization • Introduction to resources/tools for recipe analysis process • Brief review of USDA Food Buying Guide and yield information needed for recipe analysis • Recipe analysis using Appendix A of FBG – explanation and exercise • Review of standardization process and specific information needed for recipe analysis process with examples of how to incorporate WI processed products
Four Resources • USDA’s Food Buying Guide • USDA’s Quantity Recipes • Wisconsin Processed Commodities Meal Pattern Contribution Guide based on Fact Sheets • Measuring Success with Standardized Recipes (NFSMI/USDA Team Nutrition)
Resource #1 USDA Food Buying Guide for Child Nutrition Programs
Food Buying Guidefor Child Nutrition Programs January 1984 Revised November 2001 Updated December 2007
Sections of the FBG 7 Sections & Index: • Introduction/Tables • M/MA • V/F • G/B • Milk • Other Foods • Appendices A–E
Tables and Figures: Use for Accuracy; Use for Efficiency Tables and Figures _________ Child Nutrition Programs
Table 1: List of Abbreviations and Symbols Used Use this table as a resource to ease written communication and avoid production errors.
Table 5: Decimal Weight Equivalents 1 lb 3 oz =(16 oz + 3 oz) = 1.19 lb 119 oz =(112 oz + 7 oz) = 7.44 lb
Table 7: Converting Decimals to Nearest Portion of a Cup for V/F One of the steps in the recipe analysis process includes converting decimal equivalents to nearest portion
Weightis measured in ounces and is used for determining portion size for most M/MAandmanyG/B. Tool: scale Volume is measured in fluid ounces and is used for determining portion size of V/F and milk. Tools: measuring devises Important Point: Do Not ConfuseWeight and Volume Measure
An 8 fl oz Cup May Not Weigh 8 oz Fill an 8 fl oz cup with lettuce and another with mashed potatoes. Their volume measures exactly the same (8 fl. oz. or 1 cup). Will they weigh the same? Will either weigh 8 oz?
Common Measures for Volume, Liquid & Dry Teaspoons, tablespoons, cups, fractions of a cup, pints, quarts, and gallons are all volume measures which can be described in fluid ounces.
Section 1 Meat/Meat Alternates ________ Child Nutrition Programs
Section 2 Vegetables/ Fruits (V/F) ___________ Child Nutrition Programs
Section 3 Grains/ Breads(G/B) Child Nutrition Programs
Column 1: Food As Purchased (As Purchased) Food As Purchased (AP) Column 1 tells you the name of the food item and the form(s) in which it is purchased. Are the apples fresh, canned, frozen, or dehydrated?
Column 2: Purchase Unit Purchase Unit Common purchase units of food such as: • Pounds • Gallons • No. 10 can • No. 300 can
Column 3: Servings per Purchase Unit (Edible Portion) Servings per Purchase Unit, EP Column 3 lists the amount of food to purchase or order based on the Servings per the designated Purchase Unit in column 2
Column 4: Serving Size per Meal Contribution Serving Size per Meal Contribution Serving sizes listed in column 4 are commonly used
Columns 3 & 4 Servings per Purchase Unit, EP For example, a No. 10 can yields 50.4 1/4-c servings of canned apple slices. Serving Size per Meal Contribution
Column 5: Purchase Units for 100 Servings Purchase Units for 100 Servings Column 5 is used to determine the amount of food to purchase for 100 servings
Column 6 Additional Information Column 6 provides additional information about the food item when it is served in a different form
Column 6 Additional Information For example, it takes 1 pound of apples, fresh, 125-138 count, AP, to provide 0.91 pound of ready-to-serve raw, cored, unpeeled apple, EP. 1 No. 10 Can = 89.0 oz (11-7/8 c) drained apple.
Exercise #1 • Use Food Buying Guide to find number of servings in purchase unit for items listed • Page numbers are provided • Mark the pages with post-it notes
RECIPE ANALYSIS USING Food Buying Guide • Yield Information • Appendix A
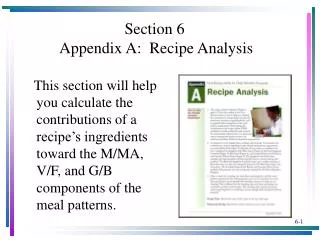
Appendix A: Recipe Analysis Purpose: Calculate the contributions of a recipe’s ingredients toward meeting components: *Meat/Meat Alternate *Vegetable/Fruit *Grains/Breads
Recipe Analysis Steps • List ingredients • Record AP weight or volume • Record purchase units • Record the number of servingsper purchase unit • Calculate the M/MA contribution • Calculate the V/F contribution • Calculate the G/B contribution • Record the portions per recipe • Record the final rounded downcalculated crediting answers
Recipe Analysis Step 1 Column 1 List Ingredients
Recipe Analysis Step 1 • Column 1: List ingredients • List only ingredients that • make contribution • Record description of each ingredient, for example fat content of ground beef • Group ingredients that contribute to the same component
Recipe Analysis Step 2 Column 2 Quantity of Ingredients as Purchased
Recipe Analysis Step 2 • Column 2: Record “As Purchased” • weight or volume of ingredients • Convert ounces to decimal • equivalent of a pound using • Table 5 (page I-36) • Quantity must be in the same • units as the purchase unit • recorded in column #1
Recipe Analysis Step 3 Column 3 Record Purchase Units
Recipe Analysis Step 3 • Column 3: Record purchase units • How is the product purchased • (for example, No. 10 cans, • pounds, dozen, etc.)? • Find this information in • Column 2 of the Food Buying • Guide • Quantity must be in the same • units as the purchase unit • recorded in recipe analysis form Column 2
Recipe Analysis Step 4 Column 4 Servings per Purchase Unit in Food Buying Guide
Recipe Analysis Step 4 Column 4: Record the number of servings per purchase unit • Find this information in Column 3 of the Food Buying Guide • Pay attention to the description of • “food as served” when making selection of information to use. • Example: Raw carrots in recipe are cooked when served, then use yield information for cooked carrots
Recipe Analysis Step 5 Column 5 Meat/Meat Alternate Contribution
Recipe Analysis Step 5 Column 5: Calculate the Meat/Meat Alternate (M/MA) Contribution • For each M/MA - multiply number in • Column 2 by number in Column 4 • Record in Column 5 to two decimal points • If more than one M/MA, add all numbers • in Column 5 and record in • “Total” row. • Divide the total of Column 5 by the • number of portions in recipe. • Round down to the nearest 1/4 ounce Note: USDA crediting rule: must be 1/8 ounce
Recipe Analysis Step 6 Column 6 Vegetables/Fruit Contribution
Recipe Analysis Step 6 • Column 6: Calculate the Vegetable/Fruit (V/F) contribution • For each V/F, multiply number in Column 2 by number • in Column 4, and record in Column 6 to two decimal points • If more than one V/F, add all numbers in Column 6 to determine the total number of 1/4-cup V/F servings in the recipe • Divide the total of Column 6 by 4 to convert to cups • Divide the number of cups by the number of portions the recipe yields. • Round the number to two decimal places and convert to the nearest portion of a cup by using Table 7 (see page • I-37 of Food Buying Guide)
Recipe Analysis Step 7 Column 7 Grains/Breads Contribution
Recipe Analysis Step 7 • Column 7: Calculate the G/B contribution. • For each G/B, multiply number in • Column 2 by number in Column 4, and record • in Column 7 to two decimal points. • If more than one G/B, add all numbers in • Column 7 to determine the total number of G/B servings in the recipeand record • Divide the number of G/B servings bythe number of portions the recipe yields • Round the number down to the nearest 1/4-serving of G/B