Download
1 / 61
610 likes | 771 Views
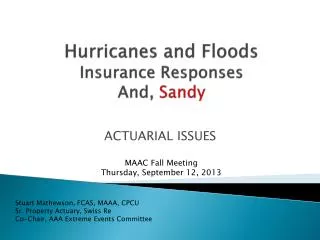
Hurricanes and Floods Insurance Responses And, Sandy. ACTUARIAL ISSUES. MAAC Fall Meeting Thursday, September 12, 2013. Stuart Mathewson, FCAS, MAAA, CPCU Sr. Property Actuary, Swiss Re Co-Chair, AAA Extreme Events Committee. Agenda. Hurricane Modeling Hurricane Insurance/Reinsurance

E N D
Hurricanes and FloodsInsurance ResponsesAnd, Sandy ACTUARIAL ISSUES MAAC Fall Meeting Thursday, September 12, 2013 Stuart Mathewson, FCAS, MAAA, CPCU Sr. Property Actuary, Swiss Re Co-Chair, AAA Extreme Events Committee
Agenda • Hurricane Modeling • Hurricane Insurance/Reinsurance • Flood Insurance - NFIP • Hurricane Sandy • Questions and Answers
WHAT is Cat Modeling? What? • Computer simulation of catastrophic events • Run against a portfolio of property risks • Gives an estimate of how much loss will be incurred in the event • Somewhat “black box”
WHY Do We Use Cat Modeling? Why? • To estimate potential loss to a company • To determine pricing of cat portion of account • Much better than previous approaches • Low frequency/High severity events • Actual data is nearly useless • Industry-wide use promotes market stability
How is the Cat Modeling Done? How • Four modules • Science 1 • Simulates a cat event (e.g., hurricane) • Science 2 • Calculates the loss drivers (e.g., wind speed) at the various location affected • Engineering • Estimates damage to structures from the event • Financial • Calculates insured loss from the damage • Library of possible events, with probabilities
How is the Cat Modeling Done? • Brief explanation of hurricane modeling
x Definition of a Hurricane Key Parameters Forward Velocity (VF) Landfall Location (LF) Track Angle of Landfall (a) Rmax Eye CentralPressure Hurricane Hugo
Cat 5 Cat 4 Cat 3 Cat 2 Cat 1 An Average of 1.66 Hurricanes per Year in United States
Cat 5 Cat 4 Extreme Hurricane on Average Every 5.8 Years
Hurricane Strikes by Region 13 Recorded Landfalls (1899-1996) 63 35 Northeast 3 34 Mid-Atlantic 34 Southeast Gulf Florida Texas
Assess WindField Quantify Risk Define Hurricanes Calculate Damage Hurricane Modeling Methodology Science -Stochastic Event Module Science - Hazard Module Engineering - Vulnerability Module Financial Analysis Module
Define Hurricanes • Determination of key hurricane variables • Central pressure • Radius of maximum winds • Forward speed • Landfall point and direction • Probabilities of each storm
Modeling Windfields from Hurricanes Maximum windspeed experienced from Hurricane Hugo 1989 Peak Gusts in mph 150 + 150 - 140 140 - 130 130 - 120 120 - 110 110 - 100 100 - 90 90 - 80 80 - 70 70 - 60 60 - 50
Terrain Effects on Windspeeds Surface roughness and fetch affect wind speed estimation. Rougher terrain causes larger frictional effects on the windspeed .
70 60 50 40 Mean Damage Ratio (%) 30 20 10 0 Wind speed Vulnerability Curves Hurricane vulnerability curves represent the relationship between wind speed experienced and damage caused to the buildings
Financial Analysis Model • Insurance or reinsurance losses can be calculated from different financial perspectives including: Ground-up, gross, net after reinsurance, catastrophe reinsurance cover • Attachment points for can be specified at location, policy, account or portfolio level • Model takes into account all affected properties in a given scenario
Modeled Hurricane Risk by State Average Homeowners’ Rates 1.6 1.4 1.2 1 0.8 0.6 0.4 0.2 0 TX LA MS AL FL GA SC NC VA WV MD DE PA NJ NY CT RI MA NH VT ME
HOW Do We Use Cat Modeling? Model Input • Location of building • Construction • Number of stories • Year built • Occupancy • Secondary characteristics
HOW Do We Use Cat Modeling? Model Output • Annual Average Loss (AAL) • Standard deviation of AAL (SD) • PML levels • E.g., 100-yr • That is, how much loss do we expect with a probability of 1%?
HOW do we use Cat Modeling? Example of PML Curve
HOW do we use Cat Modeling? • Pricing needs to include provision for the cost of potential loss • Plus a load to pay for the risk • For the capacity we have to allocate for the potential loss • For the riskiness in having accumulations in hazardous areas • For the volatility of frequency of loss
Hurricane Insurance & Reinsurance • Price based on • Location • Susceptibility of the area • Distance to the coast • Construction • Terms • Higher deductibles – often percentage of value • Market • Near coast, often many companies exclude wind loss • Wind pools are prevalent • Flood (including storm surge) is almost always excluded • Leads to issues of which peril caused the loss
Flood Insurance – National Flood Insurance Program (NFIP) • Property insurers determined long ago that flood was not insurable • In 1968, Congress passed an act to establish NFIP • By 1973, most communities were up and running • Some key points • Flood insurance available only in communities that established mandated controls • Buildings built before establishment of flood maps were charged subsidized rates • Program needs to be re-authorized periodically • Later laws mandated insurance for properties with federally insured mortgages
Flood Insurance – National Flood Insurance Program (NFIP) • Some key points (cont.) • Intent is that program be self sufficient • In years that losses and expenses exceed premiums, NFIP can borrow from Treasury • Until 2004, NFIP was able to pay back Treasury in non-catastrophe years • Until 2005, borrowing limit was $1.5b • After Katrina, limit was raised to $21b • After Sandy, limit was raised to $30b • Current debt is $24b • Current annual premiums about $3.5b • Full-risk ("actuarial") rates vs Subsidized rates
Brief background – AAA involvement • Previous Flood authorization expired in 2008 • AAA Extreme Events Committee started work on paper to address flood issue • Congress took 4 years – and numerous short-term authorizations to pass new law • The National Flood Insurance Program: Past, Present...and Future? – 2011 • Purpose was to educate on the Flood program to aid in the public discourse • Primary audiences • Actuaries • Decision makers
Brief background – AAA involvement • Capitol Hill briefing on monograph (July, 2011) • Comment letters and written testimony to Congress when deliberations were ongoing (e.g., 6/28/12) • Presentations to NCOIL and NAIC (2011,2012)
Biggert-Waters Flood Insurance Reform and Modernization Act of 2012 • Phases out subsidies for second homes, businesses and severe repetitive loss properties (25%/year) • Any policy for property not currently covered must pay "actuarial" rates • Raises cap on annual increases from 10 to 20% • Sets up reserve fund • Requires NFIP to set up a schedule to repay debt • Requires several studies by GAO, Treasury and others
Current Events • Conversation with GAO on privatization • One of the studies mandated by Biggert-Waters • Discussed general actuarial views on privatization • Comment letter on HR1035 • Community-based Flood Insurance
Privatization • Why was flood deemed uninsurable? • Only those who would often get flooded were interested in buying it • Premium for those properties alone would be prohibitive • Small premium base wouldn't support catastrophic potential
Privatization • Do past issues still exist? • Current situation • No one stepping in to profit from this niche • Some companies offer excess coverage on high valued properties • Large commercial properties usually covered in all-risk policies • Few buy NFIP insurance unless forced • And, enforcement not consistent when mandated • Can new technologies help? • Wharton/CoreLogic Study • A Methodological Approach for Pricing Flood Insurance & Evaluating Loss Reduction Measures: Application to Texas
Privatization • Can it be properly rated? And would those rates be sustainable in the market? • Expected Losses can be estimated by models • Much more granular rating than NFIP • NFIP has no capital requirements – therefore, no capital cost load – private companies would need a significant load • An estimate has been made that rates would have to be roughly doubled if written privately • Can it develop a broad base? • Without a mandate, it's hard to foresee increase in take-up rates
Reinsurance or Capital Markets • Can these mechanisms be used to support the NFIP? • At current rate levels, there is little premium to cover the cost of private reinsurers • Could Federal government act as reinsurer instead of simply a lender? • One idea – Federal government pays for private market reinsurance • Would provide a stable expense for the government • Private/Public partnership in vogue now for some • Politically viable?
Reinsurance or Capital Markets • Can these mechanisms be used to support a private market? • This could be a key piece of privatization – but requires enough premium to pay for the reinsurance
Community-based Flood Insurance • HR1035 – mandating a study on community-based flood insurance • What does this envision? • Community is the insured • Risk assessment and pricing for community as a whole • Covers all properties in the community • Pros as per sponsors • Streamlined underwriting • Increased participation • Incentive for community-based mitigation • Issues • How do you decide how the taxpayers pay? • How do you get individual communities interested?
Should the Debt be Forgiven • At current rate levels, it would take decades to repay debt – even without further major occurrences • After Katrina, about $20B – paid down to $17B+ by 2011 • After Sandy, up to $24B • Biggert-Waters requires FEMA to create a repayment schedule • Must submit to Congress a report on options to eliminate debt in 10 years
Should the Debt be Forgiven • Reserve • Required by Biggert-Waters • 1% of "total loss potential" in force • Fund at 7.5% of reserve ratio until capitalized • If NFIP unable to make the minimum contribution, it must report this to Congress • How is this to be paid for?
Flood Modeling • Hydrological model • Basis for NFIP rates • Probabilistic models • Even more difficult to model than earthquake • Needs data at a very small granular detail for a large area of the country • Changes to river basins often change significantly • Not currently as useful for US insurers as for Europe
Sandy • Weird storm • Hurricane or not? • Flood/Wind/Earth Movement • Issues • Legal • Legislative/Political • NFIP
Cat 5 Cat 4 Cat 3 Cat 2 Cat 1 Historical Storm Tracks
Weird Storm • As we have seen in the maps, it is very rare to have a storm curve into land in New Jersey • NASA study • Typically, the tropical storms and hurricanes that strike the Northeast are pushed in a northeasterly direction by the prevailing upper level winds • Most storms hit the coast at a grazing angle, and only areas of land that stick out into the ocean, such as Cape Hatteras, N.C., and Cape Cod, Mass., have a long history of experiencing storms that hit at a perilous perpendicular angle. • But with Sandy, the combination of a storm diving southeast from Canada, into the Midwest, and a large high pressure area in northeastern Canada and southern Greenland pinned the storm and forced it westward into the East coast