Download

1 / 54
540 likes | 723 Views
Guide For Arrhythmia Recognition. Cheryl Sabin, MSN, ANP And other ANP faculty, Indiana University. Objectives. Recognize and explain the basic conduction system of the heart Able to accurately measure: PR interval QRS duration QT interval Analyze the rate and rhythm of EKG strips.

E N D
Guide For Arrhythmia Recognition Cheryl Sabin, MSN, ANP And other ANP faculty, Indiana University
Objectives • Recognize and explain the basic conduction system of the heart • Able to accurately measure: • PR interval • QRS duration • QT interval • Analyze the rate and rhythm of EKG strips
Objectives • Recognize and distinguish what area of the conduction system is pacing the heart • Able to state appropriate treatment responses to various identified rhythm strips
The ECG • Electrodes on the skins surface records the electrical activity of the heart. • Monitoring cables are connected to the skin electrodes and attached to the monitor or ECG machine • The horizontal axis corresponds with time. • The vertical axis = voltage or amplitude.
ECG Paper • ECG paper normally records at 25mm/se • Each horizontal 1mm box represents 0.04 sec. (25mm/sec x 0.04 sec = 1mm).
ECG Paper • The lines between every 5 boxes are heavier indicating one large box. Each large horizontal box is 0.20 sec • 5 large boxes = 1 sec. • Thirty large boxes = 6 sec. • A small box is 1 mm high, a large box is 5mm high.
*Waveform* • P Wave: represents atrial depolarization and the spread of the electrical impulse throughout the right and left atria. • P Wave Characteristics: • Smooth & round • No more than 2.5 mm in height or 0.11 sec in duration
PR • PR Segment: horizontal line between the end of the P wave and the beginning of the QRS complex. • Normally isoelectric • PR Interval: P wave + PR segment = PRI • Represents the interval between the onset of atrial depolarization and ventricular depolarization.
PRI Time from impulse from SA to AV node
PR Cont. • PR Interval cont. • Measured from the point where the P wave leaves the baseline to the beginning of the QRS. • Normally measures 0.12 to 0.20 sec. • Normally shortens as heart rate increases.
QRS • QRS Complex: consists of the Q, R, & S waves and represents the spread of electrical impulse through the ventricles. Ventricular depolarization. • Q Wave: is always a negative waveform. • It represents depolarization of the interventricular septum • Measures less than 0.04 sec in duration and less than 25% of the amplitude of the R wave.
Waveforms • R Wave: is the first positive deflection of the QRS • S Wave: is a negative deflection following a R wave.
Waveforms • The R & S wave represents the simultaneous depolarization of the R & L ventricles. • The QRS complex typically represents the electrical activity which occurs within the Left ventricle due to it’s greater muscle mass.
QRS • Measuring of QRS • The width of the QRS is taken from the point where the first wave of the complex leaves the baseline. The point at which the last wave form returns to thebaseline marks the end of the QRS complex. • Duration of the QRS varies between 0.06 and 0.10 sec.
ST • ST Segments: portion between the QRS complex and the T wave. • Is the term used regardless of the final wave of the QRS. • Represents the early part of repolarization of the R&L ventricles. • Normal ST segment is isoelectric
Waveforms • T Wave: Represents ventricle repolarization. • The absolute refractory period ends at the peak of the T wave and the relatively refractory period begins.
Waveform • T Wave Characteristics: • The T wave is typically oriented in the same direction as the preceding QRS complex. • The T wave is slightly asymmetric
QT • QT Interval: Represents the time from ventricular depolarization to repolarization. • QT is measured from the beginning of the QRS complex to the end of the T wave. • To determine if the QT is WNL: measure between R-R waves. If the QT interval is less than ½ the R-R interval it is considered normal.
Calculating Rate • Assess the Rate: • Six-second Method: 30 large boxes = 6 sec. • Ventricular Rate: count the number of QRS complexes in the 6 sec. strip and multiply that number by 10. • Large Box Method: • Count the number of large boxes between 2 consecutive R waves and divide into 300. May also calculate the Atrial rate the same way.
Calculating Rate • Sequence Method: • Select an R wave that falls on a dark vertical line. Number the next 6 consecutive dark vertical lines as follows: 300, 150, 100, 75, 60, and 50.
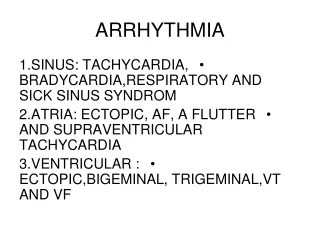
Sinus Rhythms • Normal Sinus Rhythm or Regular Sinus Rhythm(NSR,RSR) • Rate: 60-100. • Rhythm: regular. • P waves Configuration: All look alike; upright in standard leads I,II, aVF, inverted in aVR • P-R interval: Normal 0.10-0.20 seconds and constant • QRS duration: Normal 0.04-0.12 seconds.
Sinus Bradycardia • Rate: less than 60 beats per minute. • Rhythm: Regular. • P waves: Configuration: all look alike(see NSR) one P before each QRS. • P-R interval: Normal 0.10-0.20 seconds and constant. • QRS duration: Normal 0.04-0.12 seconds.
Sinus Brady • What drugs induce SB? • When do you treat SB? • Why do they have symptoms?
Sinus Tachycardia (Sinus Tach) • Rate: 100-150( maybe 180, depends on who’s book you read!) • Rhythm: Regular • P waves: All look alike( see NSR). One P wave before each QRS • PRI: Normally shortens as heart rate increases. • QRS duration: Normal 0.04-0.12 sec.
Rate: 60-100 but it is variable. Rate increases with inspiration and decreases with expiration. Rhythm: Irregular; varies with respiratory cycle Sinus Arrhythmia(happens to all of us!)
Sinus Arrest • Rate: Variable; often slow • Rhythm: Interrupted by pauses when the SA node “fails to fire.” Regular until absence of a P wave; duration of the pause is not a multiple of the P-P interval or the underlying rhythm
Sinus Block(SA Exit Block) • Impulse originates in pacemaker cells of SA node but is blocked as it exits. • Rate: Variable; often slow • Rhythm: Regular except for pause periods; overall the rhythm is not interrupted.
Atrial ArrhythmiasPremature Atrial Contractions • P waves: Shape of premature P wave often differs. One P wave for each QRS. PAC occurs early; no compensatory pause(usually). • P-R interval: Interval for PAC usually different than is sinus cycles. • QRS duration: Normal duration; QRS of premature beat usually the same as the sinus conducted QRS • Rhythm: Interrupted by premature contraction
Atrial TachycardiaParoxysmal Atrial Tach-PAT • Rate: 180-250 • Rate is the only difference from Sinus Tach. • Rhythm: Regular unless associated with AV block-PAT marked by sudden onset and sudden cessation. • P waves: Often buried in preceding T wave-tent like appearance.One P for each QRS • P-R interval: Not measurable because of rapid rate.
Atrial Flutter • Rate: Ventricular rate varies depending upon the degree of AV block( 250-350).It is Regular. • Rhythm: Dependent on block; regular if block is constant • P Waves: Flutter waves are saw tooth pattern or undulating atrial waves. • P-R interval: Not measured. • QRS duration: Normal
??? • What if the rate is so fast you can’t tell what they are in???? • What is SVT? • What does this do to CO?
SVT vs. A.Flutter • Rhythm strip following Adenosine
Atrial Fibrillation • Ventricular rate • > 100 = uncontrolled <100 = controlled • Atrial rate: 350-500 • Rhythm: Usually Irregular ! • P waves: Not identifiable • P-R interval: Can’t be determined • QRS duration: Normal