Download
1 / 36
360 likes | 507 Views
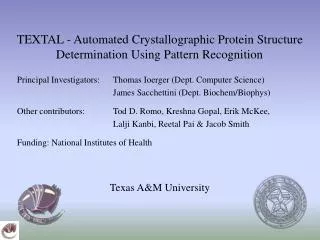
TEXTAL - Automated Crystallographic Protein Structure Determination Using Pattern Recognition. Principal Investigators: Thomas Ioerger (Dept. Computer Science) James Sacchettini (Dept. Biochem/Biophys) Other contributors: Tod D. Romo, Kreshna Gopal, Erik McKee,

E N D
TEXTAL - Automated Crystallographic Protein Structure Determination Using Pattern Recognition Principal Investigators: Thomas Ioerger (Dept. Computer Science) James Sacchettini (Dept. Biochem/Biophys) Other contributors: Tod D. Romo, Kreshna Gopal, Erik McKee, Lalji Kanbi, Reetal Pai & Jacob Smith Funding: National Institutes of Health Texas A&M University
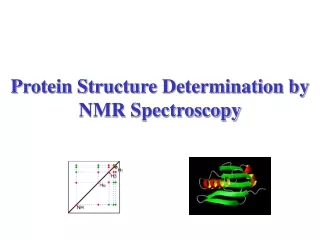
X-ray crystallography • Most widely used method for protein modeling • Steps: • Grow crystal • Collect diffraction data • Generate electron density map (Fourier transform) • Interpret map i.e. infer atomic coordinates • Refine structure • Model-building • Currently: crystallographers • Challenges: noise, resolution • Goal: automation
X-ray crystallography • Most widely used method for protein modeling • Steps: • Grow crystal • Collect diffraction data • Generate electron density map (Fourier transform) • Interpret map i.e. infer atomic coordinates • Refine structure • Model-building • Currently: crystallographers • Challenges: noise, resolution • Goal: automation
Overview of TEXTAL • Automated model-building program • Can we automate the kind of visual processing of patterns that crystallographers use? • Intelligent methods to interpret density, despite noise • Exploit knowledge about typical protein structure • Focus on medium-resolution maps • optimized for 2.8A (actually, 2.6-3.2A is fine) • typical for MAD data (useful for high-throughput) • other programs exist for higher-res data (ARP/wARP) Electron density map (or structure factors) Protein model (may need refinement) TEXTAL
Crystal Collect data Electron density map Diffraction data LOOKUP: model side chains CAPRA: models backbone SCALE MAP TRACE MAP CALCULATE FEATURES PREDICT Cα’s BUILD CHAINS PATCH & STITCH CHAINS REFINE CHAINS Model of backbone Model of backbone & side chains POST-PROCESSING SEQUENCE ALIGNMENT REAL SPACE REFINEMENT Corrected & refined model
CAPRA: C-Alpha Pattern-Recognition Algorithm tracing • Best-first search with heuristic • scoring function based on: • neural net scores • density • connectivity • secondary structure Neural network: estimates which pseudo-atoms are closest to true Ca’s linking
Example of Ca-chains fit by CAPRA Rat a2 urinary protein (P. Adams) data: 2.5A MR map generated at 2.8A % built: 84% # chains: 2 lengths: 47, 88 RMSD: 0.82A
Stage 2: LOOKUP • LOOKUP is based on Pattern Recognition • Given a local (5A-spherical) region of density, have we seen a pattern like this before (in another map)? • If so, use similar atomic coordinates. • Use a database of maps with known structures • 200 proteins from PDB-Select (non-redundant) • back-transformed (calculated) maps at 2.8A (no noise) • regions centered on 50,000 Ca’s • Use feature extraction to match regions efficiently • feature (e.g. moments) represent local density patterns • features must be rotation-invariant (independent of 3D orientation) • use density correlation for more precise evaluation
BUILD CHAINS: Examines network of Cα’s and use heuristic search to connect them to form backbone chains CAPRA
LOOKUP: Uses case-based reasoning to find, for each Cα, the best matching local region in a database
The LOOKUP Process Find optimal rotation Database of known maps Two-step filter: 1) by features 2) by density correlation “2-norm”: weighted Euclidean distance metric for retrieving matches: Region in map to be interpreted
Examples of Numeric Density Features • Distance from center-of-sphere to center-of-mass • Moments of inertia - relative dispersion along orthogonal axes • Geometric features like “Spoke angles” • Local variance and other statistics Features are designed to be rotation-invariant, i.e. same values for region in any orientation/frame-of-reference. TEXTAL uses 19 distinct numeric features to represent the pattern of density in a region, each calculated over 4 different radii, for a total of 76 features.
F=<1.72,-0.39,1.04,1.55...> F=<1.58,0.18,1.09,-0.25...> F=<0.90,0.65,-1.40,0.87...> F=<1.79,-0.43,0.88,1.52...>
SLIDER: Feature-weighting algorithm • Euclidean distance metric used for retrieval: • importance of relevant features, avoid noisy features • Goal: find optimal weight vector w the generates highest probability of hits (matches) in top K candidates from database • Concept of Slider: • analyze distances between representative matches and mismatches • adjust features so the most matches are ranked higher than mismatches Slider Algorithm(w,F,{Ri},matches,mismatches) choose feature fF at random for each <Ri,Rj,Rk>, Rjmatches(Ri),Rkmismatches(Ri) compute cross-over point li where: dist’(Ri,Rj)=dist’(Ri,Rk) dist’(X,Y)= l(Xf-Yf)2+(1-l)dist\f(X,Y) pick l that is best compromise among li ranks most matches above mismatches update weight vector: w’update(w,f,l), wf’=l repeat until convergence
Quality of TEXTAL models • Typically builds >80% of the protein atoms • Accuracy of coordinates: ~1Å error (RMSD) • Depends on resolution and quality of map
PcaA • Mycolic acid cyclopropyl synthase (Smith&Sacchettini) • original structure solved at 2.0A via MAD R-value = 0.22, R-free = 0.27 • 287 residues, a/b fold Example of density quality (~1s contour with Ca trace)
Comparison to backbone of true structure (white) Percent built = 89% (missing: 15-residue N-terminus, 17-residue disordered loop) 4 single-atom insertions; 5 single-atom deletions RMSD = 0.81A
CAPRA model consists of 3 chains Chain lengths: 14, 96, 145 residues
Comparison of TEXTAL model to true structure Percent amino acid identity = 87.5% (mistakes: small frame-shifts around gaps in alignment) all-atom RMSD = 0.92A
Implementation • Project started in 1998 • Collaboration between TAMU Computer Science & Biochemistry departments • 100,000 lines of C/C++, Perl, Python code • ~8 developers • CVS for version management • Platforms: Irix, Linux, OSX, Win32 • Speed: 1-3 hours for medium-sized proteins
Deployment • September 2004: Linux and OSX distributions • Can be downloaded from http://textal.tamu.edu:12321 • 40 trial licenses granted so far • June 2002: WebTex (http://textal.tamu.edu:12321) • Till May 2005: TB Structural Genomics Consortium members only • Recently open to the public • ~500 jobs successfully processed • 120 users from 70 institutions in 20 countries • July 2003: Model building component of PHENIX • Python-based Hierarchical ENvironment for Integrated Xtallography • Consortium members: • Lawrence Berkeley National Lab • University of Cambridge • Los Alamos National Lab • Texas A&M University • April 2005: Alpha release - over 300 downloads so far
Python-based Hierarchical ENvironment for Integrated Xtallography HYSS, CCTBX (Lawrence Berkeley Lab) Crystallography toolbox, heavy atom search, refinement PHENIX diffraction data PHASER (University of Cambridge) Maximum likelihood phasing SOLVE/RESOLVE (Los Alamos National Lab) Statistical density modification, minimum bias phasing refined molecular model TEXTAL™ (Texas A&M University) Model building
Conclusions • Pattern recognition is a successful technique for macromolecular model-building • Future directions: • recognizing disulfide bridges, metal ions, detergents... • building ligands, co-factors, etc. • using models built to iteratively improve phases • building at higher or lower resolutions • intelligent agent for guiding model-completion • detecting and exploiting non-crystallographic symmetry • building nucleic acids (RNA and DNA) • Importance and challenges of interdisciplinary research
Acknowledgements • Funding: • National Institutes of Health • Our group: • Jacob Smith, Kreshna Gopal, Lalji Kanbi, Erik McKee, Reetal Pai, Tod Romo • Our association with the PHENIX group: • Paul Adams (Lawrence Berkeley National Lab) • Randy Read (Cambridge University) • Tom Terwilliger (Los Alamos National Lab)