Slope Fields
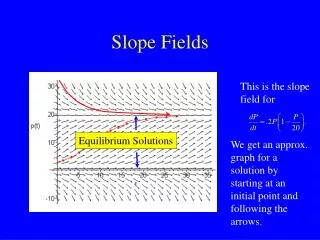
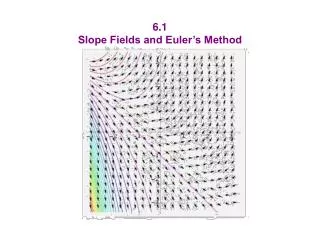
This is the slope field for. Equilibrium Solutions. Slope Fields. We get an approx. graph for a solution by starting at an initial point and following the arrows. Local Linearity and Approximation. Slope = f’ ( t 0 ). Euler’s Method. Here’s how it works.


Slope Fields
E N D
Presentation Transcript
This is the slope field for Equilibrium Solutions Slope Fields We get an approx. graph for a solution by starting at an initial point and following the arrows.
Local Linearity and Approximation Slope= f’(t0)
Euler’s Method Here’s how it works. Suppose we have a DE that tells us the value of the derivative of a function at any point and an initial condition. We can build an approximate graph of the solution using local linearity to approximate over and over again. This iterative procedure is called Euler’s Method. Dt
Implementing Euler’s Method What’s needed to get Euler’s method started? • Well, you need a differential equation of the form: • y’ = f (t , y) • And an initial condition (t0,y0) that lies on the graph of the solution function y(t). A smaller step size will lead to more accuracy, but will also take more computations. • Finally, you need a fixed step size • Dt. New t = Old t + Dt New y = Old y + Dy = Old y + f (Old t, Old y)) Dt
For instance, if y’= sin(t2) and (1,1) lies on the graph of y = y(t), then 1000 steps of length .01 yield the following graph of the function y. This graph is the anti-derivative of sin(t2); a function which has no elementary formula!
How do we accomplish this? Suppose that y’ = t sin(y) and (1,1) lies on the graph. Let Dt=.1. New t = Old t + Dt New y = Old y + Dy = Old y + y’(Old t, Old y) Dt