Download
1 / 9
90 likes | 111 Views
Learn to plot points and graph functions on a coordinate plane, understanding quadrants and identifying ranges effectively. -

E N D
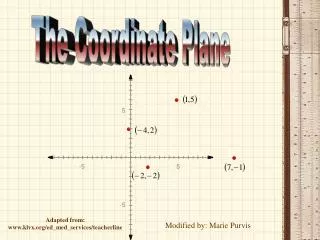
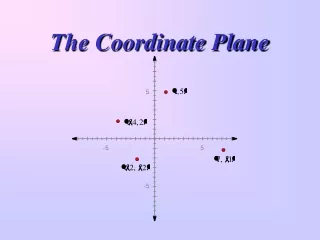
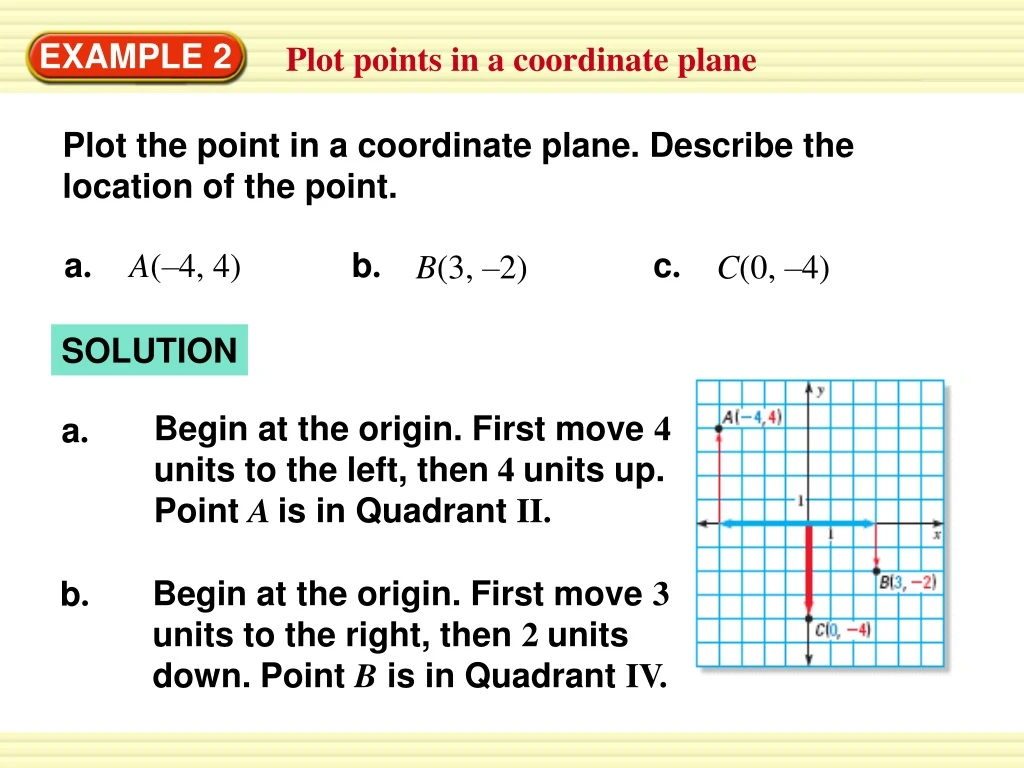
a. A(–4, 4) b. c. B(3, –2) C(0, –4) SOLUTION Begin at the origin. First move 4 units to the left, then 4 units up. Point A is in Quadrant II. a. Begin at the origin. First move 3 units to the right, then 2 units down. Point Bis in Quadrant IV. b. EXAMPLE 2 Plot points in a coordinate plane Plot the point in a coordinate plane. Describe the location of the point.
Begin at the origin and move 4 units down. Point Cis on the y-axis. c. EXAMPLE 2 Plot points in a coordinate plane
SOLUTION STEP1 Make a table by substituting the domain values into the function. EXAMPLE 3 Graph a function Graph the function y = 2x – 1 with domain –2, –1, 0, 1, and 2. Then identify the range of the function.
STEP2 List the ordered pairs: (–2, –5), (–1, –3), (0, –1), (1, 1), (2, 3). Then graph the function. EXAMPLE 3 Graph a function
STEP3 Identify the range. The range consists of the y-values from the table: –5, –3, –1, 1, and 3. EXAMPLE 3 Graph a function
ANSWER Quadrant I for Examples 2 and 3 GUIDED PRACTICE Plot the point in a coordinate plane. Describe the location of the point. 3.A(2, 5)
ANSWER x-axis ANSWER Quadrant III for Examples 2 and 3 GUIDED PRACTICE Plot the point in a coordinate plane. Describe the location of the point. 4.B(–1, 0) 5.C(– 2, –1)
ANSWER Quadrant II for Examples 2 and 3 GUIDED PRACTICE Plot the point in a coordinate plane. Describe the location of the point. 6. D(–5, 3)
7. Graph the function y = – x + 2 with domain –6, –3, 0, 3, and 6. Then identify the range of the function. 1 ANSWER range: 0, 1, 2, 3, and 4 3 for Examples 2 and 3 GUIDED PRACTICE Plot the point in a coordinate plane. Describe the location of the point.