Download
1 / 30
300 likes | 485 Views
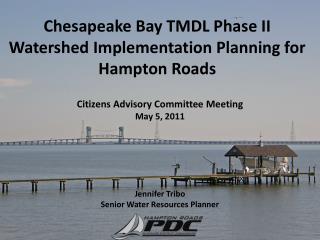
Chesapeake Bay TMDL Phase II Watershed Implementation Planning for Hampton Roads. Citizens Advisory Committee Meeting May 5, 2011. Jennifer Tribo Senior Water Resources Planner. Hampton Roads. HRPDC and the Chesapeake Bay TMDL. 1996-2001: Locality nutrient reduction strategy options

E N D
Chesapeake Bay TMDL Phase II Watershed Implementation Planning for Hampton Roads Citizens Advisory Committee Meeting May 5, 2011 Jennifer Tribo Senior Water Resources Planner
HRPDC and the Chesapeake Bay TMDL • 1996-2001: Locality nutrient reduction strategy options • 2003-2005: James River Tributary Strategy • 2006: Implementation Plans for local impairments. • 2009: Commission briefings on TMDL development. • 2010: Attended meetings of Virginia’s Chesapeake Bay Stakeholder Advisory Group. • 2010/2011: Developed cost estimates for implementation of urban stormwater reductions and commented on Draft TMDL and VA WIP.
Promoting Regional Cooperation • Elected Officials • Monthly Commission Meetings • Locality Staff • Stormwater Committee, Directors of Utilities, Chesapeake Bay Committee • Other Agencies • Joint Environmental Committee • SWCDs, Navy, HRSD, DEQ, DCR, USGS
Virginia’s Watershed Implementation Plan • Significant reductions required for agriculture. • Phased Implementation in the James River. • Chlorophyll a study • Wastewater held at 2005 Permit levels with exception of Lower James River. • No net increase in loads for new development. • Extensive urban nutrient management • Additional reductions from existing development.
Phase II WIP Development • Phase II WIPs due March 2012 • EPA’s expectations for Phase II WIPs: • Divide target nutrient reductions into a finer geographic scale (counties, sub-watersheds) • Identify specific controls and practices that will be implemented, no later than 2017, to meet interim water quality goals.
Overview of Virginia Approach • Develop locality targets from TMDL basin allocations. • Engage local governments and other stakeholders through Planning District Commission. • Guide localities through development of Community Conservation Information.
Virginia’s Phase II WIP Schedule • June 2011 - Draft load reduction targets to localities based on final TMDL • July 2011 – EPA delivers revised load reductions to State. • August 2011 – Revised load reduction target to localities. • November 2011 - Localities submit final conservation strategies to Virginia. • December 2011 – Virginia submits draft Phase II WIP to EPA.
Concerns with Virginia’s Approach • Timeframe • Definition of local scale • Accountability for reductions from unregulated sources • Risk that permitted sources held liable for nutrient reduction gaps • Technical and financial assistance
Timeframe • 3 months is not enough time to effectively engage stakeholders • Localities need more time to evaluate the nutrient reduction potential of sources and develop Community Conservation Information. • Local TMDL Implementation Plans took an average of 12 months to complete. • Piedmont Regional Pilot Project spent 10 months on stakeholder outreach.
Definition of Local • Virginia has defined local as locality, but may allow nutrient reduction strategies at other scales. • Who decides the appropriate scale? • Watershed scale is best for water quality. • Locality scale is cleaner for implementation. • Questions on application of the model at the local scale.
Accountability for Unregulated Sources • State plan relies heavily on voluntary nutrient and sediment reductions. • What incentives will the State give non regulated sources to define and achieve reductions? • How will the State address gaps if non regulated localities do not identify enough load reductions to meet the target?
Liability for Permitted Sources • Wastewater treatment plants and MS4s at risk of being held accountable for nutrient reduction gaps. • This approach will make it more difficult and expensive to restore the Bay. • Creates more challenges to meet local water quality goals. • Need balance of incentives and consequences to be successful.
Technical and Financial Assistance • Localities need loading targets and baseline BMP data to begin planning. • State needs to provide guidance on tools and methodologies for assessing nutrient reduction potential. • Localities and PDCs need funding for data analysis and stakeholder involvement. • Level of financial assistance depends on timeframe for plan development.
Hampton Roads Approach to Phase II WIP • Create Regional Framework for stakeholder involvement and policy development. • Set “rules” for addressing source sector reductions outside local government control. • Create Local Government Frameworks • Recommend establishment of interdepartmental teams. • Assist local governments with data collection and analysis.
Phase II WIP – Initial Steps • Assess nutrient loadings and sources at a Regional Scale. • Identify potential challenges to planning and implementation. • Identify opportunities /incentives related to TMDL implementation.
Hampton Roads Land Cover NOAA 2005 Coastal Change Analysis Program (C-CAP) Regional Land Cover dataset for Virginia
Hampton Roads Pollutant Sources Nitrogen Phosphorus James River York River
Regulated Sources in Hampton Roads • Significant Wastewater Discharges • 8 Hampton Roads Sanitation District discharges • Stormwater • 6 Phase I MS4s • 6 Phase II MS4s • Permitted Federal facilities • VDOT • Multiple Industrial discharges
Major Challenges to Implementation • Defining the appropriate local scale. • Cost of urban stormwater management. • Creating flexibility for trading between regulated and unregulated sources. • Expanding the options for nutrient reduction strategies. • Local government needs.
Cost Effective Nutrient Management • No Discharge Zones • Oyster Restoration • Wetlands Restoration • Green Infrastructure Planning and Implementation • Education Programs • Street Sweeping
Local Government Needs • Funding • Planning • Implementation • Better information on the Bay Models and input data. • Tools for determining local nutrient reduction potential.
Incentives and Opportunities • Improved local water quality. • Improved quality of life. • Threat of future regulatory action. • Opportunity for trading to create financial incentives. • Opportunity for technical innovations.
Questions Jennifer Tribo jtribo@hrpdcva.gov 757-420-8300