
GL 261
E N D
Presentation Transcript
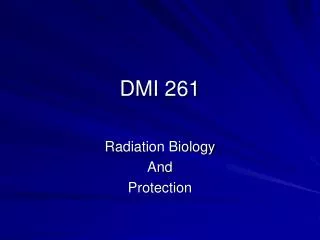
Supplementary Figure S1. Hematoxylin and eosin (H&E) staining (left panel) and ASP+ fluorescence labeling (right panel) of adjacent sections containing a GL261 glioma tumor 14 days after implantation. The H&E image was taken with an Olympus IX71 fluorescent microscope using the brightfield filter. The ASP+ fluorescent image was taken using an Olympus Fluoview FV1000 confocal microscope with a FITC excitation – emission filter set using a 40x objective. The scale bar shows 30 µm.
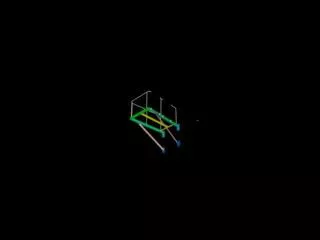
Supplementary Figure S2. 3D image of a GL261 glioma tumor in a living brain slice 14 days after tumor implantation. ASP+ fluorescence of glioma cells and astrocytes is colorized in green. The red arrow shows intratumoral cavities and blood vessels. The blue arrows show astrocytes in the adjacent healthy brain tissue.
GL 261 HS683 U 87 ASP+ staining Viability test controls Viability test 4h ASP+ application Supplementary Figure S3. Fluorescence imaging of cultured GL261, HS683, and U87 glioma cells. (Images taken using an Olympus IX71 fluorescent microscope with a dual green and red fluorescence filter set and 20x objective.) Top panel: Red fluorescence is observed in GL261 mouse and U87 and HS683 human glioma cell lines 30 min after application of 1µM ASP+. Middle and bottom panels: Images demonstrating the viability of GL261, U87, and HS683 glioma cells in the absence (Middle Panel) and presence (Bottom Panel) of ASP+ (1 µM for 4 hours). In these images, live cells are green, whereas dead cells are red because of labeling with calcein (4 µM) and ethidium (2 µM), respectively. The bottom panel shows cumulative fluorescence of ASP+ and calcein/ethidium so the green (calcein) labeling has a red/yellow tint. In U87, cells ASP+ uptake is stronger than in other cell lines, so the red tint in U87 is brighter in some cells, and showing as yellow.
Supplementary Figure S4. Graph representing the % of dead GL261, U87, and HS683 glioma cells in culture for control cells and cells treated with ASP+ (1 µM for 4 hours). No significant difference between control (not treated with ASP+) and ASP+ treated cells is found (n = 3).