Download
1 / 15
150 likes | 283 Views
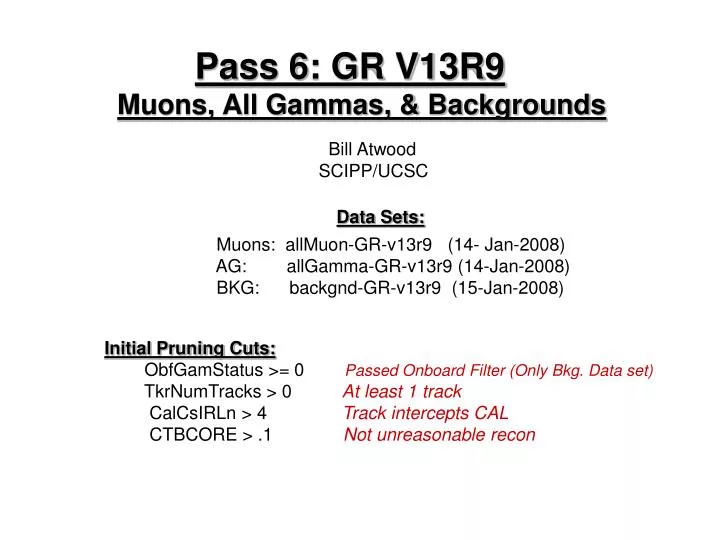
Pass 6: GR V13R9 Muons, All Gammas, & Backgrounds. Bill Atwood SCIPP/UCSC. Data Sets: Muons: allMuon-GR-v13r9 (14- Jan-2008) AG: allGamma-GR-v13r9 (14-Jan-2008) BKG: backgnd-GR-v13r9 (15-Jan-2008). Initial Pruning Cuts:

E N D
Pass 6: GR V13R9 Muons, All Gammas, & Backgrounds Bill Atwood SCIPP/UCSC Data Sets: Muons: allMuon-GR-v13r9 (14- Jan-2008) AG: allGamma-GR-v13r9 (14-Jan-2008) BKG: backgnd-GR-v13r9 (15-Jan-2008) Initial Pruning Cuts: ObfGamStatus >= 0 Passed Onboard Filter (Only Bkg. Data set) TkrNumTracks > 0 At least 1 track CalCsIRLn > 4 Track intercepts CAL CTBCORE > .1 Not unreasonable recon
Normalizations & Irreducibles Live time = 2 sec/Run * No. Runs * .925 (Dead Time Corr.) DT Corr = 55,270,161 evts * 26 msec/event /(2* (10000-447)) sec total run time = .925 Irreducible Event Filter Cuts ((McZDir < -.2 & McId < 20) | Acceptance FoV for e+ , e- & g (McZDir < .1 & McId > 20)) & Acceptance FoV for protons McAcdZEnter > 100 & Enters Tracker McCharge !=0 & Isn't a Photon McTHPosHitOthers < 6 & Not enough hits to track anything but e+ & e- McAcdActDistTileEnergy < .2 Entering Tile has little energy Cuts to blind Irred. Filter to Ribbons !(((abs(McAcdXEnter)< 519 & abs(McAcdXEnter) > 485 ) | (abs(McAcdXEnter)< 181 & abs(McAcdXEnter) > 155 ))| ((abs(McAcdYEnter)< 519 & abs(McAcdYEnter) > 485 ) | (abs(McAcdYEnter)< 181 & abs(McAcdYEnter) > 155 ))| (abs(McAcdXEnter)> 820 & abs(McAcdYEnter) > 820 )) As noted in Pass 5: The ratio of proton events to QED is different - predict ~ 30% have 4%! ??
CPF Analysis Background Events Live time = 7370 sec ( Used first 3984 runs) (499957 events) CPF Acceptance & Quality Bkg. Cut: 50048 Bkg.events left McZDir < -.2 & McAcdZEnter > 100 & McCharge != 0 & CTBCORE > .1 & CalCsIRLn > 4 Remove Irreducible Events: 47827Bkg. events left Events use Pass 5 definition All Gammas: First 200k Events (corresponding to 2.65 x 10⁶ generated) Quality Cuts: 165322 events Left CTBCORE > .1 & CalCsIRLn > 4
Schematic Use Ribbons to close gaps between ACD Tiles Kill Tracks pointed at the ACD Corner Gaps Veto Events with 1st Track pointed at hit Tile Remove events with excess Total ACD Energy Cut to remove events with low pulse height near Tile edges Compute Energy compensated variables for CT usage Compute CPFGamProb using CT Ensemble and Clean-up Pass 6 CPF Analysis • What's new since Pass 5 • Using Ribbons as intended • Usage of scaled ACD energies • Improved understanding of where self veto comes from
Ribbon Cut AcdRibbonActDist > -(2 +350/sqrt(max(20,CTBBestEnergy))) & AcdRibbonEnergy > .05 & (was .1) Tkr1SSDVeto < 3 AcdTkr1RibbonDist > -2 & Tkr1SSDVeto < 2Try eliminating blanking out Ribbons Percentages The >650 ZEROs maybe a problem Low Cut Used! Inefficiency circled in RED Very low pulse height cuts, makes analysis vulnerable to mismatch to as-built equipment
Percentages ACD Corner Cut Most distances used in this analysis are scaled by This makes the cut Energy dependent. Selection: Tkr1LATEdge < 150 & Tkr1SSDVeto < 3 Vetoed Events shown in PURPLE AcdCornerDocaENorm = AcdCornerDoca*(min(1000, max(30, CTBBestEnergy)))^.5/10. ACD Corner Cut (Tkr1LATEdge ^ 2 + (AcdCornerDocaENorm - 10)^ 2 < 3600 | (Tkr1LATEdge < 80 & abs(AcdCornerDocaENorm-2) < 4)) & Tkr1SSDVeto < 3
ACD Basic Tile Energy Cut Example 1 Cut: Tkr1SSDVeto == 0 & AcdTkr1ActiveDist > 0 & AcdTkr1ActDistTileEnergy > 1. Example 2 Cut: Tkr1SSDVeto < 5 & AcdTkr1ActiveDist > 0 & AcdTkr1ActDistTileEnergy > .2 Example 1 Low & High Energy Bands Note: This portion of the CPF Analysis was done with v13r7 since my v13r9 datasets all had the min. basics Active Dist. - Tile Energy cut applied in the Skimmer. Self Veto Study Plot the ratio of events in Low & High energy bands as a function of the Tile Energy Cut. Having jumped ahead to the end of the analysis, there is an appreciable leakage of high energy events that can be missed by this cut. This sets limits on how liberal one can be with the Active Distance and associated Tile Energy. The scaled ACD energies become less capable as the reconstructed event energy increase (ie. > 10 GeV). These suggest that the Active Dist. Min is -16mm and Tile energy is .4 MeV. Fortunately the SSD req. is == 0 Tkr1SSDVeto == 0 Tkr1SSDVeto <= 1 Tkr1SSDVeto <= 2 Tkr1SSDVeto <= 4 Story
Two Choices for the Basic Veto Cut #1 #2 Tkr1SSDVeto == 0 & AcdTkr1ActiveDist > 0 & AcdTkr1ActDistTileEnergy > 1. Tkr1SSDVeto == 0 & AcdTkr1ActiveDist > -16 & AcdTkr1ActDistTileEnergy > .4 This cut more reflects our usage in practice This was the cut used in the Skimmer Correlation between Basic and Total Energy Cuts Cost of #2 over #1: 936 Events (.7%) USING #2 This really helps reduce the high energy residual Bkg. events
ACD Total Tile Energy Cut • Scaled ACD Tile Energies • Scaling the ACD energies to the total reconstructed energy lessens the self veto effect dramatically. Two scale energy variables are considered: • AcdTileEventEnergyRatio = AcdTkr1ActDistTileEnergy/CTBBestEnergy * 100 • AcdTotalTileEventEnergyRatio= AcdTotalEnergy/CTBBestEnergy * 100 • Advantages & Disadvantages • Scaled responses automatically increase amount in ACD require to Veto an event as E increases • The dependence on Tracking (along with its ~ 2% mis-tracking) is greatly reduced • However as CTBBestEnergy increase, eventually even a MIP is passed… First Cut AcdTotalTileEventEnergyRatio > .8 Note: something akin to this could be done onboard the LAT!
The simple cut can be improved on by using Tracking (AcdTkr1ActiveDistENorm) Vetoed Events shown in BLUE Total Tile Energy Cut AcdTotalTileEventEnergyRatio > .8 | (AcdTkr1ActiveDistENorm > -300 & AcdTotalTileEventEnergyRatio > max(.005, .1 - .0001*AcdTkr1ActiveDistENorm)) More can be gained by using the single tile energy associated with the 1st Track. This is helpful near the tile edges where the pulse height is low ZOOM IN Tile Edge Energy Cut abs(AcdTkr1ActiveDistENorm) < 15 & AcdTotalTileEventEnergyRatio > .005
CT Analysis: To divide the data or not to divide the data? A key factor in using the ACD are the SSD Vetoes. It is natural to break the data into subsets according the number of SSD Vetos Case 1: No division 1 CT Case 2: 0 and > 0 SSD Vetoes 2 CTs
CPF CT Choose no division as nothing gained. Greatly amplified the statistics here by including all the available data (nominally 20k sec worth)
Muon Hermiticity Test CPFGamProb > 0 50 Events 2.8 x 10⁻⁴ 178384 Events For McTkr1DirErr < .01: No. Events = 174752 and 10 with CPFGamProb > 0 (98.0 %) (0.6 x 10⁻⁴) 10 Events 50 Events
Pass 6 - Pass5 CPF Performance Comparison Note: These plots use the v13r7 data - skimmed v13r9 data have Basic Cut applied Conclusion: Pass 6 is an order of magnitude better the Pass 5 while retaining the same Gamma efficiency!