Download
1 / 101
1.01k likes | 1.04k Views
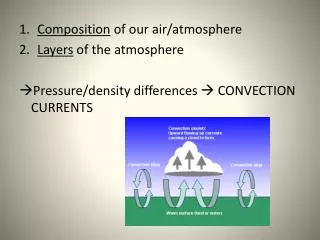
Our atmosphere. Earth’s atmosphere = the layer of gases that surround the planet Very thin layer, relative to size of planet Atmosphere: • Absorbs solar radiation • Burns up meteors • Transports and recycles water, and other chemicals • Moderates climate. Atmosphere composition.

E N D
Our atmosphere • Earth’s atmosphere = the layer of gases that surround the planet • Very thin layer, relative to size of planet • Atmosphere: • • Absorbs solar radiation • • Burns up meteors • • Transports and recycles water, and other chemicals • • Moderates climate
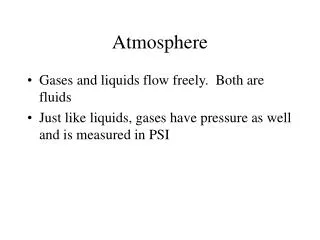
Atmosphere composition • 78% nitrogen21% oxygen1% argontraces of other gases: water vapor carbon dioxide methane pollutants
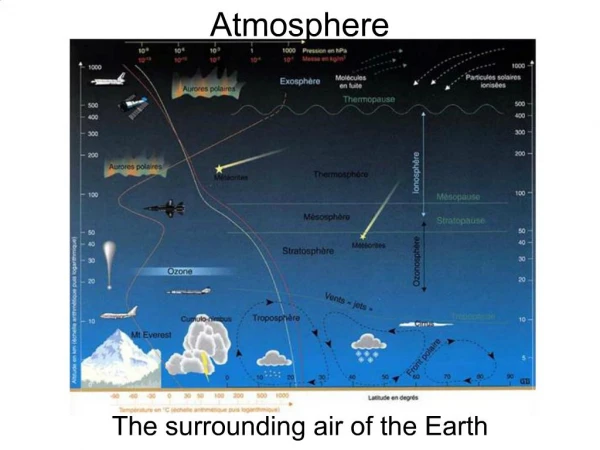
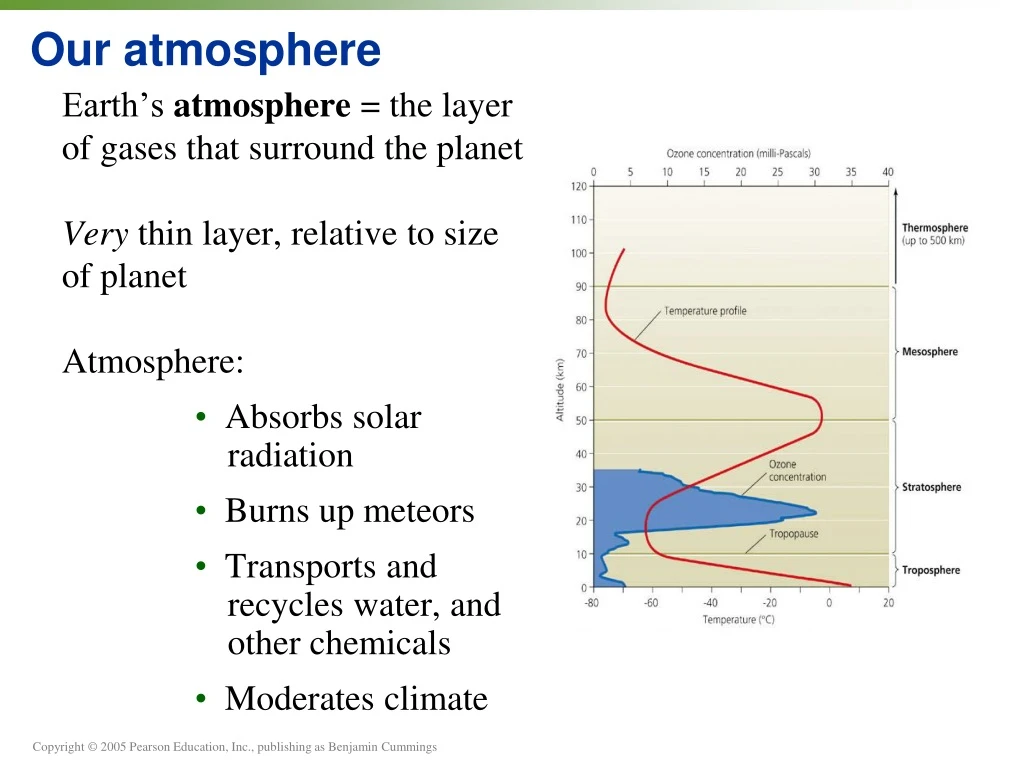
Atmospheric layers • Atmosphere consists of several layers: • Troposphere = Bottom layer, at Earth’s surface. 11 km high. Temperature decreases with altitude. • Stratosphere = Next layer up (11–50 km). Temperature increases with altitude. Contains “ozone layer.” • Mesosphere = Third layer up (50–90 km). Temperature decreases with altitude. • Thermosphere = Top layer (90–500 km). Very thin air; mostly lightweight elements. Very hot.
Atmospheric layers • Temperature and other characteristics vary with altitude. Ozone layer Tropopause marks boundary between troposphere and stratosphere. Layers don’t mix. Figure 11.3
Not really a layer, but a region of higher-than-normal ozone concentrations (which are still very low) ~17–30 km altitude Ozone = O3—molecule of 3 oxygen atoms Absorbs ultraviolet (UV) radiation from sun, protecting organisms on surface from radiation damage Ozone layer
Create Atmosphere Quadrafold • One side for each layer: • Title • Vertical range of layer • Temperature change according to elevation • Special characteristic of that layer • Drawing which helps you remember the layer name with its characteristics • Pg 480 in your text will help you
Stratospheric ozone depletion • Ozone in troposphere = harmful pollutant • Ozone in stratosphere = beneficial layer protecting us from UV radiation • “Ozone layer”— ~ 12 parts per million in lower stratosphere—is enough to absorb UV and protect us. • But in the 1960s scientists noticed ozone concentrations were dropping.
Stratospheric ozone depletion • In 1974, Sherwood Rowland and Mario Molina pegged the blame on chlorofluorocarbons (CFCs). • They won the Nobel Prize for this scientific detective work. • CFCs = human-made molecules in which hydrogens of hydrocarbons are replaced by chlorine and fluorine atoms • Mass-produced by industry, in refrigerants and consumer products like aerosol sprays
Stratospheric ozone depletion • In 1985, the “ozone hole” was detected over Antarctica. • Ozone levels had declined 40–60% over the previous decade. Figure 11.17a
Stratospheric ozone depletion • Scientists worried about the effects of extra cancer-causing UV on people, organisms, ecosystems. The ozone hole (blue) reached its greatest extent in September 2000 (satellite imagery). Figure 11.17b
Stratospheric ozone depletion • In 1987, over 180 nations signed the Montreal Protocol, which restricted CFC production globally. • Follow-up agreements strengthened the pact. • Today CFC levels are down, and stratospheric ozone is starting to recover. • The Montreal Protocol is one of the biggest environmental success stories of our time. • We have apparently avoided a major environmental problem.
Stratospheric ozone depletion • Reasons for success of the Montreal Protocol: • • Government and industry cooperated on finding solutions (cheap replacement technologies for CFCs), so battles typical to environmental debates were minimized. • • Protocol was implemented with “adaptive management”—ability to fine-tune actions as time goes on, in response to new data or conditions.
Radiation, atmosphere, and temperature Figure 12.1
Weather and climate Weather = local physical properties of the troposphere, including temperature, pressure, humidity, cloudiness, wind Climate = pattern of atmospheric conditions across large geographic regions over long periods of time (seasons, years, millennia) “Climate is what we expect; weather is what we get.” –Mark Twain
Global climate patterns … result from differential heating of Earth’s surface. And from gigantic convection currents called Hadley cells, Ferrel cells, and polar cells
Global convection currents Hadley cells: air rises at equator, falls at 30º latitude. Ferrel cells: air falls at 30º, rises at 60º. Polar cells: air rises at 60º, falls at 90º. Figure 11.10a
Global wind patterns • These 3 types of cells also influence wind patterns near the ground. • The Coriolis effect (planet’s rotation causes land at the equator to spin more quickly than temperate land) causes north-south winds to appear to be deflected, and to curve. Figure 11.10b
Outdoor air pollution • Air pollution = material added to the atmosphere that can affect climate and harm organisms, including humans • Air pollution can come from human-made chemicals and causes, but the majority is from natural sources.
Natural sources of air pollution dust storms volcanoes fires Figure 11.11
Artificial sources of air pollution • Human-caused air pollution includes: • Point sources = specific spots where large amounts of pollution are discharged • (factory smokestacks) • Non-point sources = diffuse, often made up of many small sources • (charcoal fires from thousands of homes)
Artificial sources of air pollution • Human-caused air pollution includes: • Primary pollutants = emitted into troposphere in a directly harmful form • (soot, carbon monoxide) • Secondary pollutants = produced via reaction of substances added to the atmosphere with chemicals already present in the atmosphere • (ozone in troposphere)
Six “criteria pollutants” • The EPA closely tracks 6 major types of pollutants: • • Carbon monoxide (CO) • • Sulfur dioxide (SO2) • • Nitrogen dioxide (NO2) • • Tropospheric ozone (O3) • • Lead (Pb) • • Particulate matter
Six “criteria pollutants” • Emissions of all of these, especially lead and carbon monoxide, have substantially declined since 1970. Figure 11.12
CO / SO2 /NO2 • Carbon monoxide (CO) = colorless, odorless gas. From vehicle exhaust and other sources. Dangerous; prevents oxygen uptake. • Sulfur dioxide (SO2) = colorless gas. From coal burning for electricity and industry. Contributes to acid precipitation. • Nitrogen dioxide (NO2) = foul-smelling red gas. From vehicle exhaust, industry, electricity. Contributes to smog and acid precipitation.
O3 / Pb/particulate matter • Tropospheric ozone (O3) = colorless gas. Secondary pollutant from sunlight, heat, nitrogen oxides (NOx), and C-containing chemicals. Contributes to smog; harmful to living tissues. • Lead (Pb) = metal in atmosphere as particulate. From gasoline additive, phased out in 1980s. Diverse health impacts, all bad. • Particulate matter = any solid (or liquid) particles small enough to be carried aloft in air. Dust, soot, sulfates, nitrates. Causes respiratory damage.
Success against lead • A major source of lead, an additive in gasoline, was banned when its health effects became obvious. • This came about through cooperative action among government, industry, scientists, citizens. • Lead emissions in the U.S. dropped 93% between 1982 and 2001. • Huge victory for public health • Example of what can be done
Volatile organic compounds • “VOCs” are regulated by many governments. • Large group of potentially harmful carbon- containing chemicals used in industrial processes • Hydrocarbons are one example. • About half are human-made, half natural. • VOCs contribute to smog, produce secondary pollutants. • Most of the 188 pollutants identified by 1970 Clean Air Act are VOCs.
Industrial smog • Smog from industrial pollution, fossil-fuel combustion • The kind that blanketed London in 1952 • “Gray air smog” • Contains soot, sulfur, CO, CO2…
Industrial smog • The U.S. had its own “killer smog” from industrial pollution. Shown is Donora, Pennsylvania, in 1948, at mid-day. Subsequent demand for legislation against pollution made U.S. air much cleaner. Figure 11.14b
Industrial smog • Chemistry of industrial smog: • • Burning sulfur-rich oil or coal creates SO2, SO3, sulfuric acid, ammonium sulfate. • • Carbon leads to CO2 and CO. Figure 11.14a
Photochemical smog • Smog from reaction of sunlight with pollutants • The kind that blankets so many American cities today • “Brown air smog” • Contains tropospheric ozone, NO2, VOCs, 100 more… • Hot sunny days in urban areas create perfect conditions.
Photochemical smog • Mexico City and many of the world’s cities suffer from the brownish haze of photochemical smog. • Inversion layers and mountains can trap smog over certain cities. Figure 11.15a
Photochemical smog • Chemistry of photochemical smog: • Nitric oxide starts a chain reaction. • Reaction with sunlight, water vapor, hydrocarbons, results in over 100 secondary pollutants. Figure 11.15b
Acid precipitation • Acid rain, acid fog, acid snow • Caused by reaction of pollutants like SO2 and NO with water, oxygen, and oxidants to form acids that fall to surface in precipitation: • sulfuric acid (H2SO4) • nitric acid (HNO3) • Like ozone depletion, this is another transboundary pollution issue, i.e., it crosses political boundaries.
Acid precipitation • Acid precipitation is created by reactions in the atmosphere, and can fall many miles from where pollution originated. Figure 11.18
Acid precipitation • Acidity varies geographically. (Orange = more acidic) Industrialized areas and regions downwind of them suffer most. Figure 11.20
Acid precipitation • Acid precipitation has killed these conifer trees in the mountains of North Carolina. From The Science behind the Stories
Acid precipitation • This can be seen in data from New Hampshire’s Hubbard Brook Experimental Forest, where acid rain was first studied. pH has increased (rain has become less acidic) since 1970, but is still much more acidic than normal rain. From The Science behind the Stories
Indoor air pollution • Indoor air spaces generally have MORE pollution than outdoor spaces. • U.S. citizens spend 90% of time indoors. • Countless consumer products and synthetic chemicals kept indoors are used in our daily lives. • UN estimate for world: • 2.2 million deaths/year from indoor air pollution • 0.5 million deaths/year from outdoor air pollution
Indoor air pollution In developing nations, indoor cooking fires are common, and a major health risk. Figure 11.21
Indoor air pollution • Burning fuel wood inside homes for cooking is a major source of indoor pollution in developing countries. • In developed nations, the 2 biggest threats seem to be: • cigarette smoke: lung cancer risk for smokers and those inhaling secondhand smoke • radon: naturally occurring colorless, odorless gas. Radioactive, seeps up from ground and collects in buildings. Lung cancer risk.
Other indoor air pollution risks in the home • Asbestos: in insulation, ceilings, walls... Lung disease, cancer • Organisms: mold, mildew, dander, pollen, mites... Allergic reaction • Carbon monoxide: poor ventilation, leaky furnace... CO poisoning • Formaldehyde: paneling, furniture, carpets… irritation, cancer • Lead: lead-based paint, drinking water… lead poisoning
Other indoor air pollution risks in the home • Pesticides: numerous ingredients… nervous system damage • Soot and particulates: fireplaces, woodstove… respiratory problems • VOCs: carpets, cleansers, paints, detergents… various effects • Endocrine disruptors: fire retardants, pesticides… hormone problems
Reducing indoor air pollution • Buy and use low-toxicity products • Provide good ventilation • Limit exposure to plastics, treated wood, pesticides, cleansing fluids (put in garage, not home) • Test home for radon • Test drinking water for lead from pipes • In developing world, provide ventilation, install clean-burning stoves, shift to gas
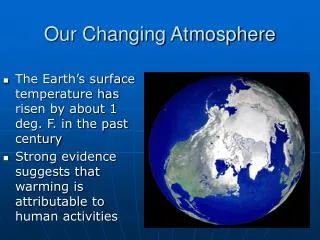
Climate and climate change • Climate = a region’s long-term pattern of atmospheric conditions, including temperature, precipitation, and other variables • Global climate change = changes in climate on a worldwide scale • Climate changes naturally, and always has, but the recent rapid warming of the planet and its change in atmospheric composition are widely thought due to human activities.
Radiation, atmosphere, and temperature • Earth’s temperature depends on how much of the sun’s radiation enters the atmosphere and how much escapes back into space. • Incoming solar radiation is: • absorbed at the surface, or • reflected by the atmosphere, or • reflected by the surface into space. • Infrared radiation emanating from Earth’s heated surface is: • emitted into space, or • absorbed by gases and kept in the atmosphere.
Radiation, atmosphere, and temperature • Atmospheric gases that absorb the emanating radiation are greenhouse gases. • By absorbing and re-emitting this radiation, they warm Earth’s atmosphere and surface, like a greenhouse. • This popularly called the greenhouse effect. • Rising concentrations of greenhouse gases in recent decades have resulted in global warming, an increase in Earth’s average surface temperature.
Carbon dioxide increase Due to: Burning of fossil fuels: We remove carbon-rich fuels from the ground where they have been stored for millions of years, and combust them in an instant, sending CO2 into the atmosphere. Deforestation: Cutting down trees, removing vegetation from the land, decreases the sink for carbon. Some of the C in plants becomes CO2 sent into the atmosphere.
Studying climate change: Direct sampling • Scientists have recorded carbon dioxide levels in the atmosphere directly since 1958, at a station in Hawaii. • The data show a steady upward climb from 315 to 373 ppm. • (The up and down zigzags are from regular winter-summer fluctuations.) Figure 12.6