Download
1 / 43
430 likes | 652 Views
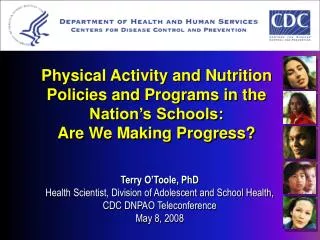
Physical Activity and Nutrition Policies and Programs in the Nation’s Schools: Are We Making Progress?. Terry O’Toole, PhD Health Scientist, Division of Adolescent and School Health, CDC DNPAO Teleconference May 8, 2008. Key Messages. Health is academic

E N D
Physical Activity and Nutrition Policies and Programs in the Nation’s Schools: Are We Making Progress? Terry O’Toole, PhD Health Scientist, Division of Adolescent and School Health, CDC DNPAO Teleconference May 8, 2008
Key Messages • Health is academic • A coordinated, multi-component, evidence-based approach is the best way to make a difference • Change has happened…
Government Agencies Family YOUTH
Most young people are enrolled in school Health programs have long been part of the school experience School health programs can improve students’ Health knowledge, attitudes, and skills Health behaviors and health outcomes Social outcomes Educational outcomes Why Schools?
Percentage of U.S. High School Students Getting Mostly A’s or B’s and Mostly D’s or F’s*Who Engage in Selected Health Risk Behaviors *As reported by students Unpublished analyses of CDC, National Youth Risk Behavior Survey, 2003
Participation in the School Breakfast Program and Academic Performance Compared to peers who do not participate in the School Breakfast Program, low-income elementary school students who do participate have: greater improvements in standardized test scores and math grades reduced rates of absenteeism, tardiness, and psychosocial problems Murphy et al. Arch Pediatr Adolesc Med 1998; Meyers et al. Am J Dis Child 1989
Physical Activity and Academic Performance Physical activity among adolescents: is consistently related to higher levels of self-esteem and lower levels of anxiety and stress.1 can positively affect concentration, memory, and classroom behavior.2 Spending more time in physical education class did not have a negative effect on students’ standardized test scores, even though less time was available for other academic subjects.3 1. Calfas and Taylor. Pediatr Exerc Sci 1994; 2. Strong et al. J Pediatr 2005; and 3. Sallis, et al. Res Q Exerc Sport 1999.
Analysis of Associations Between Time Spent in Physical Education and Academic Achievement* Nationally representative sample: 5,316 students starting kindergarten in 1998-99, followed through 5th grade PE measure: Low (0-35 mins./week), Medium (36-69), High (70-300) AA measure: Mathematics and reading tests designed by experts Higher amounts of PE not associated with AA in boys A small but significant benefit on both the math and reading tests were observed for girls in the high PE category compared with those in the low PE category *Carlson SA et al. Am J Pub Health 2008 April
www.cdc.gov/HealthyYouth/health_and_academics Journal of School Health 2007;77:589-600
“Health and success in school are interrelated. Schools cannot achieve their primary mission of education if students and staff are not healthy and fit physically, mentally, and socially.” - National Association of State Boards of Education “NSBA recognizes the critical link of health and learning and the role of schools in promoting life-long health and preventing health risk behaviors.” - National School Board Association National Perspectives on the Relationship Between Health and Education
National Perspectives on the Relationship Between Health and Education “No educational tool is more essential than good health…We believe that healthy kids make better students and that better students make healthy communities. We recognize that children who come to school hungry, are absent due to asthma, suffer from other chronic diseases such as Type 2 diabetes, are depressed or distracted by family problems, or stay away from school because of fear of violence cannot benefit fully from the sound educational programs we are putting into place to ensure that no child in our schools is left behind. Policies and practices that address the health and developmental needs of young people must be included in any comprehensive strategy for improving academic performance.” - Council of Chief State School Officers
Association for Supervision and Curriculum Development www.wholechildeducation.org
Challenging and engaging curriculum. Adequate professional development with collaborative planning time embedded within the school day. High-quality teachers and administrators. Under the New Compact for the Whole Child, Schools Provide: • A safe, healthy, orderly, and trusting environment. • A climate that supports strong relationships between adults and students. • Support for active coordinated school health council or other collaborative structures. The Whole Child, www.ascd.org
Bienestar Health ProgramSan Antonio, Texas Trevino RP et al. Impact of the Bienestar school-based diabetes mellitus prevention program on fasting capillary glucose levels: a randomized controlled trial. Arch Pediatr Adolesc Med. 2004;158:911.
Coordinated Approach to Child Health (CATCH)El Paso, Texas Source: Coleman KJ et al. Prevention of the epidemic increase in child risk of overweight in low-income schools: The El Paso coordinated approach to child health. Arch Pediatr Adolesc Med. 2005;159:217.
Planet HealthBoston, Massachusetts Source: Gortmaker SL et al. Reducing obesity via a school-based interdisciplinary intervention among youth. Arch Pediatr Adolesc Med.1999;153:409.
Linking Education, Activity and Food (LEAF) program • Grants to 16 middle and high schools in 9 California school districts. • Implement policies to promote the consumption of California grown fresh produce • Implement an array of related policies to improve student nutrition and fitness.
Coordinated School Health Program Health Education Physical Education Family and Community Involvement Health Services Health Promotion for Staff Nutrition Services Healthy and Safe School Environment Counseling, Psychological, and Social Services
Priority Strategies • Strong wellness policies • Coordinated School Health Program • Self-assessment and planning for improvement • School health council and coordinator • High-quality health education • High quality physical education • Increased physical activity opportunities • Quality school meal program • Appealing, healthy food and beverage choices outside of school meals • Health promotion for staff
States Districts Schools Elementary school Middle school High school Classrooms Health Education Family and Community Involvement Physical Education Health Services Health Promotion for Staff Nutrition Services Counseling, Psychological, and Social Services Healthy and Safe School Environment
Percentage of Schools That Almost Always or Always Used Healthy Food Preparation Practices, 2000 and 2006 CDC, School Health Policies and Programs Study, 2000 and 2006
Percentage of U.S. Schools That Offered Specific A La Carte Foods, 2000 and 2006 CDC, School Health Policies and Programs Study, 2000 and 2006
Percentage of U.S. Schools in Which Students Could Purchase Specific Items in Vending Machines or at School Stores, Canteens, or Snack Bars, 2000 and 2006 CDC, School Health Policies and Programs Study, 2000 and 2006
Percentage of Schools in Which Junk Foods and Soft Drinks Were Sold to Students in Vending Machines, School Stores, Canteens, or Snack Bars During Lunch Periods*, 2000 and 2006 *Among the schools that sold these items in these locations. CDC, School Health Policies and Programs Study, 2000 and 2006
Percentage of Schools That Sold Baked Goods Not Low in Fat for Fund-Raising for Any School Organization, 2000 and 2006 CDC, School Health Policies and Programs Study, 2000 and 2006
Percentage of States ThatRequired Schools to Prohibit Junk Foods in Specific Settings, 2000 and 2006 CDC, School Health Policies and Programs Study, 2000 and 2006
Percentage of Districts that Prohibited Use of Food or Food Coupons as Reward, 2000 and 2006 CDC, School Health Policies and Programs Study, 2000 and 2006
Percentage of Schools that Required Students Who Failed Required Physical Education to Repeat the Class/Course,* 2000 and 2006 *Among schools that required physical education CDC, School Health Policies and Programs Study, 2000 and 2006
Percentage of Districts That Had Supportive Physical Education Policies, 2000 and 2006 CDC, School Health Policies and Programs Study, 2000 and 2006
Percentage of States That Required or Encouraged Districts or Schools to Follow Standards or Guidelines Based on the National Standards for Physical Education CDC, School Health Policies and Programs Study, 2000 and 2006
Percentage of Districts That Had Adopted a Policy Stating that Schools Will Follow National, State, or District Physical Education Standards or Guidelines CDC, School Health Policies and Programs Study, 2000 and 2006
Percentage of States that Prohibited or Actively Discouraged Schools from Using Physical Activity to Punish Students for Bad Behavior in Physical Education, 2000 and 2006 CDC, School Health Policies and Programs Study, 2000 and 2006
Percentage of States and Districts That Required Elementary Schools to Provide Regularly Scheduled Recess, 2000 and 2006 CDC, School Health Policies and Programs Study, 2000 and 2006
Percentage of Districts That Provided Funding for or Offered Health Promotion Programs for Faculty and Staff,* 2000 and 2006 *During the 12 months preceding the study. CDC, School Health Policies and Programs Study, 2000 and 2006
Despite These Dramatic Improvements… 45% of middle schools and 77% of high schools allowed students to buy soft drinks from vending machines or a school store 25% of middle schools and 48% of high schools allowed students to buy junk food from vending machines or a school store during lunch period 19% of middle schools and 24% of high schools offered brand name fast foods 24% of high schools sold deep fried foods at lunch every day CDC, School Health Policies and Programs Study, 2000 and 2006
Despite These Dramatic Improvements… • Only 4% of elementary schools, 8% of middle schools, and 2% of high schools provided daily physical education for all students for the entire school year • 31% of elementary schools did not require any physical education • 31% of high schools allowed students to be exempted from physical education for inappropriate reasons • 68% of the schools that required physical education taught dodgeball • 32% of elementary schools did not provide daily recess for all students • 52% of schools did not offer intramural activities or physical activity clubs for students CDC, School Health Policies and Programs Study, 2000 and 2006
CDC-Funded State Coordinated School Health Programs WA ME ND Nez Perce Tribe MN MA ID SD WI NY MI CT OH NJ WV CO CA KY NC AZ AR SC MS Funded States www.cdc.gov/healthyyouth/partners/funded/cshp.htm
Physical Activity and Nutrition Policies and Programs in the Nation’s Schools: Are We Making Progress? Terry O’Toole, PhD Health Scientist, Division of Adolescent and School Health, CDC DNPAO Teleconference May 8, 2008