Download
1 / 26
270 likes | 803 Views
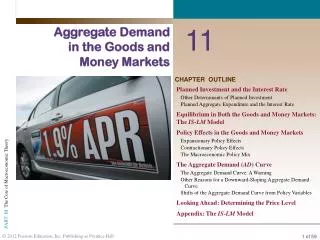
CLICK MOUSE OR HIT SPACEBAR TO ADVANCE. T11.1 Chapter Outline. Chapter 11 Project Analysis and Evaluation Chapter Organization 11.1 Evaluating NPV Estimates 11.2 Scenario and Other “What-if” Analyses 11.3 Break-Even Analysis 11.4 Operating Cash Flow, Sales Volume, and Break-Even

E N D
CLICK MOUSE OR HIT SPACEBAR TO ADVANCE T11.1 Chapter Outline Chapter 11Project Analysis and Evaluation Chapter Organization • 11.1 Evaluating NPV Estimates • 11.2 Scenario and Other “What-if” Analyses • 11.3 Break-Even Analysis • 11.4 Operating Cash Flow, Sales Volume, and Break-Even • 11.5 Operating Leverage • 11.6 Additional Considerations in Capital Budgeting • 11.7 Summary and Conclusions Finance 3040
T11.2 Evaluating NPV Estimates I: The Basic Problem • The basic problem: How reliable is our NPV estimate? • Projected vs. Actual cash flows Estimated cash flows are based on a distribution of possible outcomes each period • Forecasting risk The possibility of a bad decision due to errors in cash flow projections - the GIGO phenomenon • Sources of value What conditions must exist to create the estimated NPV? • “What If” analysis: A. Scenario analysis B. Sensitivity analysis
T11.3 Evaluating NPV Estimates II: Scenario and Other “What-If” Analyses • Scenario and Other “What-If” Analyses • “Base case” estimation Estimated NPV based on initial cash flow projections • Scenario analysis Position best- and worst-case scenarios and calculate NPVs • Sensitivity analysis How does the estimated NPV change when one of the input variables changes? • Simulation analysis Vary several input variables simultaneously, then construct a distribution of possible NPV estimates
T11.4 Fairways Driving Range Example • Fairways Driving Range expects rentals to be 20,000 buckets at $3 per bucket. Equipment costs $20,000 and will be depreciated using SL over 5 years and have a $0 salvage value. Variable costs are 10% of rentals and fixed costs are $40,000 per year. Assume no increase in working capital nor any additional capital outlays. The required return is 15% and the tax rate is 15%. Revenues $60,000 Variable costs 6,000 Fixed costs 40,000 Depreciation 4,000 EBIT $10,000 Taxes (@15%) 1500 Net income $ 8,500
T11.4 Fairways Driving Range Example (concluded) • Estimated annual cash inflows: $10,000 + 4,000 - 1,500 = $12,500 net income plus dep’n - taxes • At 15%, the 5-year annuity factor is 3.352. Thus, the base-case NPV is: NPV = $-20,000 + ($12,500 3.352) = $21,900.
T11.5 Fairways Driving Range Scenario Analysis INPUTS FOR SCENARIO ANALYSIS • Base case: Rentals are 20,000 buckets, variable costs are 10% of revenues, fixed costs are $40,000, depreciation is $4,000 per year, and the tax rate is 15%. • Best case: Rentals are 25,000 buckets, variable costs are 8% of revenues, fixed costs are $40,000, depreciation is $4,000 per year, and the tax rate is 15%. • Worst case: Rentals are 18,000 buckets, variable costs are 12% of revenues, fixed costs are $40,000, depreciation is $4,000 per year, and the tax rate is 15%.
T11.5 Fairways Driving Range Scenario Analysis (concluded) Net Project ScenarioRentalsRevenuesIncomeCash FlowNPV Best Case 25,000 $75,000 $21,250 $25,250 $64,635 Base Case 20,000 60,000 8,500 12,500 21,900 Worst Case 18,000 54,000 2,992 6,992 3,437
T11.6 Fairways Driving Range Sensitivity Analysis INPUTS FOR SENSITIVITY ANALYSIS • Base case: Rentals are 20,000 buckets, variable costs are 10% of revenues, fixed costs are $40,000, depreciation is $4,000 per year, and the tax rate is 15%. • Best case: Rentals are 25,000 buckets and revenues are $75,000. All other variables are unchanged. • Worst case: Rentals are 18,000 buckets and revenues are $54,000. All other variables are unchanged.
T11.6 Fairways Driving Range Sensitivity Analysis (concluded) Net Project Sensitivity RentalsRevenuesincomecash flowNPV Best case 25,000 $75,000 $19,975 $23,975 $60,364 Base case 20,000 60,000 8,500 12,500 21,900 Worst case 18,000 54,000 3,910 7,910 6,514
T11.7 Fairways Driving Range: Rentals vs. NPV Fairways Scenario Analysis - Rentals vs. NPV NPV Best case NPV = $64,635 x $60,000 Base case NPV = $21,900 x Worst case NPV = $3,437 x 0 -$60,000 15,000 20,000 25,000 Rentals per Year
Break - Even Analysis • Where the crucial variable for a project and its success is sales volume - various forms of break-even analysis can be developed essentially addressing the question of ‘how bad can sales get before we start losing money’ • an understanding of the fixed and variable costs associated with the project is important in developing the break-even analysis. • Variable Costs - ‘costs that change when the quantity of output changes.’ Variable cost VC = total quantity (Q) * cost per unit (v) • Fixed Costs - ‘costs that do not change when the quantity of output changes during a particular time period’ • fixed costs are not fixed forever - only for a prescribed period of time; in the long run all costs are variable • Total Costs TC for a given level of output is the sum of the Variable costs VC and fixed costs FC • TC = VC+FC or v*Q + FC • Marginal or incremental cost is the change in costs that occurs when there is a small change in output - what happens to our costs when we produce one more unit
Accounting Break-Even • Accounting break-even is the sales level that results in zero project net income • P = Selling Price per unit • v = Variable cost per unit • Q = total units sold • FC = Fixed Costs • D = Depreciation • t = Tax rate • VC = Variable cost in dollars Accounting break-even; Q =(FC+D)/(P-v)
T11.10 Fairways Driving Range: Accounting Break-Even Quantity • Fairways Accounting Break-Even Quantity (Q) Q = (Fixed costs + Depreciation)/(Price per unit - Variable cost per unit) = (FC + D)/(P - V) = ($40,000 + 4,000)/($3.00 - .30) = 16,296 buckets If sales do not reach 16,296 buckets, the firm will incur losses in an accounting sense.
Operating Cash Flow, Sales Volume and Break-Even • Given our focus on cash flow, the next evolution in break-even analysis is to look at the relationship between operating cash flow and sales volume • Cash break-even - the point where operating cash flow (OCF) is zero • OCF = (P-v) *Q - FC or Q = (FC + OCF)/(P-v) • Cash break-even then is where OCF = 0 • Q = (FC + 0)/(P-v) • $40,000/2.70 =‘s 14,815 buckets
Financial Break-Even • The point where the sales level results in a zero NPV • the first step is determining OCF for the NPV to be zero • a zero NPV occurs when the PV of the OCF equals the original investment - if the cash flow is the same each year we can use the annuity formula to solve for OCF • original investment or PV = OCF * annuity future value factor • OCF = original investment/Annuity future value factor • OCF=(P-v)*Q-FC or Q = (FC +OCF)/(P-v) • the financial break-even is often greater than the accounting break-even or conversely when a project just breaks even in an accounting sense it will usually be losing money in a financial or economic sense
T11.8 Fairways Driving Range: Total Cost Calculations • Total Cost = Variable cost + Fixed cost Variable Fixed Total Total Rentals Revenue cost cost cost Dep’n acct. cost 0 $0 $0 $40,000 $40,000 $4,000 $44,000 15,000 45,000 4,500 40,000 44,500 4,000 48,500 20,000 60,000 6,000 40,000 46,000 4,000 50,000 25,000 75,000 7,500 40,000 47,500 4,000 51,500
Break-Even Example Assume you have the following information about Vanover Manufacturing: • Price = $5 per unit; variable costs = $3 per unit • Fixed operating costs = $10,000 • Initial cost is $20,000 • 5 year life; straight-line depreciation to 0, no salvage value • Assume no taxes • Required return = 20%
Break-Even Example A. Accounting Break-Even Q = (FC + D)/(P - V) = ($10,000 + $4,000)/($5 - 3) = 7,000 units IRR = 0 ; NPV = -$8,038 B. Cash Break-Even Q = FC/(P - V) = $10,000/($5 - 3) = 5,000 units IRR = -100% ; NPV = -$20,000 C.. Financial Break-Even Q = (FC + $6,688)/(P - V) = ($10,000 + 6,688)/($5 - 3) = 8,344 units IRR = 20% ; NPV = 0
T11.12 Summary of Break-Even Measures (Table 11.1) I. The General Expression Q = (FC + OCF)/(P - V) where: FC = total fixed costs P = Price per unit v = variable cost per unit II. The Accounting Break-Even Point Q = (FC + D)/(P - V) At the Accounting BEP, net income = 0, NPV is negative, and IRR of 0. III. The Cash Break-Even Point Q = FC/(P - V) At the Cash BEP, operating cash flow = 0, NPV is negative, and IRR = -100%. IV. The Financial Break-Even Point Q = (FC + OCF*)/(P - V) At the Financial BEP, NPV = 0 and IRR = required return.
Operating Leverage • Operating leverage is ‘ the degree to which a firm or project relies on fixed costs’ - what is the relationship between fixed and variable costs for the firm or project. • Low operating leverage means low fixed costs as a proportion of total costs • High operating leverage reflects high fixed costs - often high investment in plant and equipment OR in the ‘new economy high investment in research and development to develop software for example. • Once a break-even point is reached, firms or projects with high operating leverage generate higher cash flow/earnings or NPV for each additional unit sold vs firms with low operating leverage - conversely lower sales volume can magnify cash flow/earnings or NPV in the other direction! • The higher the degree of operating leverage the greater the impact from forecasting risk
Operating Leverage continued • The degree of operating leverage (DOL) is ‘the percentage change in operating cash flow relative to the percentage change in quantity sold’ • % change in OCF = DOL * % change in Q • DOL = 1+ FC/OCF • The issue of sub-contracting out certain functions is often a question of operating leverage - sub-contracting has the effect of reducing the DOL as more costs become variable and fixed costs are reduced • Firms operating in the ‘new economy’ e.g. High tech firms can have a high DOL as much of the their investment in research and development is a fixed cost that does not vary with sales volumes - thus the higher degree of leverage to sales volumes
Fairways Driving Range DOL • Since % in OCF = DOL % in Q, DOL is a “multiplier” which measures the effect of a change in quantity sold on OCF. • For Fairways, let Q = 20,000 buckets. Ignoring taxes, OCF = $14,000 and fixed costs = $40,000, and Fairway’s DOL = 1 + FC/OCF = 1 + $40,000/$14,000 = 3.857. In other words, a 10% increase (decrease) in quantity sold will result in a 38.57% increase (decrease) in OCF. • Two points should be kept in mind: Higher DOL suggests greater volatility (i.e., risk) in OCF; Leverage is a two-edged sword - sales decreases will be magnified as much as increases.
Managerial Options and Capital Budgeting • Managerial options and capital budgeting • What is ignored in a static DCF analysis? Management’s ability to modify the project as events occur. • Contingency planning 1. The option to expand 2. The option to abandon 3. The option to wait • Strategic options 1. “Toehold” investments 2. Research and development
Capital Rationing • Capital rationing • Definition: The situation in which the firm has more good projects than money. Soft rationing - limits on capital investment funds set within the firm. Hard rationing - limits on capital investment funds set outside of the firm (i.e., in the capital markets). …firm is in financial distress, external capital essentially becomes unavailable • What would be the opposite of capital rationing – more money than good projects – what then? ………firms start buying back shares
DOL Example • A proposed project has fixed costs of $20,000 per year. OCF at 7,000 units is $55,000. Ignoring taxes, what is the degree of operating leverage (DOL)? • If units sold rises from 7,000 to 7,300, what will be the increase in OCF? What is the new DOL? DOL = 1 + ($20,000/$55,000) = 1.3637 % Q = (7,300 - 7,000)/7,000 = 4.29% and % OCF = DOL(% Q) = 1.3637 (4.29) = 5.85% New OCF = ($55,000)(1.0585) = $58,218 DOL at 7,300 units = 1 + ($20,000/$58,218) = 1.3435