Download
1 / 24
240 likes | 457 Views
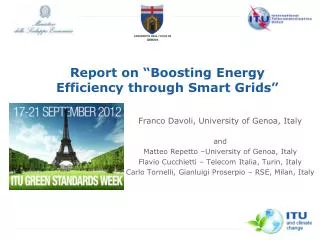
Overview of the ITU Report on “Boosting Smart Grids Through Energy Efficient ICT” . Flavio Cucchietti – Telecom Italia, Turin, Italy Franco Davoli, Matteo Repetto –University of Genoa, Italy Carlo Tornelli, Gianluigi Proserpio – RSE, Milan, Italy. Outline. Climate change and GHG emissions

E N D
Overview of the ITU Report on “Boosting Smart Grids Through Energy Efficient ICT” Flavio Cucchietti – Telecom Italia, Turin, Italy Franco Davoli, Matteo Repetto –University of Genoa, Italy Carlo Tornelli, Gianluigi Proserpio – RSE, Milan, Italy
Outline • Climate change and GHG emissions • Responsibility of the electrical system in GHG emissions • The need for Smart Grids • The role of ICT in reducing GHG emissions • ICT and the Smart Grid • Energy footprint of ICT infrastructures • Smart grids in different economies
Climate change and GHG emissions GHG emissions are expected to grow much faster than in the last two centuries. GHG emissions are largely ascribable to production of electricity.
Responsibility of the electrical system in GHG emissions - 1 Large fluctuations in electricity demand during seasons and daily hours… … require overprovisioning power plants and the electrical grid.
Responsibility of the electrical system in GHG emissions - 2 Production is made by a mix of efficient - yet static - base bulk and dynamic - yet inefficient - generation during peak hours. Oil and coal fired power plants are the most widespread solution for bulk generation. They are responsible for GHG emissions for electricity production.
The need for Smart Grids • Sustainability of the electrical system requires the evolution towards new paradigms (Smart Grid), pursuing high efficiency and integration of renewables • this is expected to cut down GHG emissions. • Issues for the implementation of Smart Energy Grids: • Load management, Distributed Generation, Microgrids, Energy Storage, Grid Management, Market operations, Electrical Vehicles, … • Much intelligence is needed to: • retrieve, share, process, store and transmit information; • make grid management automatic, reliable, resilient, safe and secure.
The role of ICT in reducing GHG emissions The ICT sector can enable emission reductions in a number of ways: Standardizing: ICT can provide information in the form of standards on energy consumption and emissions, across the sectors; Monitoring: ICT can incorporate monitoring information into the design and control of energy use; Accounting: ICT can provide the capabilities and platforms to improve accountability of energy and carbon; Rethinking: ICT can offer innovations that capture energy efficiency opportunities across buildings/homes, transport, power, manufacturing and other infrastructures, and provide alternatives to current ways of operating, learning, living, working and travelling; Transforming: ICT can apply smart and integrated approaches to energy management of systems and processes, including benefits from both automation and behavioural change and develop alternatives to high carbon activities, across all sectors of the economy.
The role of ICT in reducing GHG emissions • By reducing ICT’s own footprint • to avoid wasting part of the previous gains. • Cutting off the carbon footprint • By enabling smart applications: • smart motors, smart buildings, smart logistics, smart grid, dematerialization; • 15% of total predicted emissions!
ICT and the Smart Grid • ICT supplies the pillars for the development of the Smart Grid • data management and processing • communication infrastructures • control and management operations • Issues • too many contexts • system of systems • heterogeneous communication technologies • integration and interoperability
ICT and the Smart Grid – 2 • Layout of the communication system: • Distributed services and applications • SOA, REST, Web Services • Data models and information exchange • CIM, IEC61850, DLMS/COSEM • Networking • SN, LAN/HAN, NAN/MAN, WAN • Communication media and technologies • Wired (Ethernet, xDSL), Power-Line (HomePlug, HomePNA, HomeGrid), Wireless (ZigBee, Z-wave, WiFi, WiMax, GSM, UMTS/LTE).
Energy footprint of ICT Energy footprint of ICT is continuously increasing. Large scale deployment for the implementation of Smart Grids will further raise current forecasts!
Energy footprint of ICT – 2 An example: Future broadband network’s Energy footprint estimation Sources: 1) BroadBand Code of Conduct V.3 (EC-JRC) and “inertial” technology improvements to 2015-2020 (home and access cons.) 2) Telecom Italia measurements and evaluations (power consumption of metro/core network and number of devices) • Homes and Distribution grids are expected to be the most critical environments. • millions of such sites in the whole system.
Energy footprint of ICT – 3 • most devices are left powered on even when not used • often to maintain “network presence”; • inefficient standby states • Energy usage of ICT equipment is increasing in homes, owing to: • more ICT devices • laptops, set-top-boxes, smart phones, handhelds, tablets, … ;
Energy footprint of ICT – 4 • By considering only the home network (which is the most critical one, due to numerousness), with reference to a medium-size country (Italy) • devices’ energy consumption as per the EC BroadBand Code of Conduct 2012 target • 33,000,000 homes and small enterprises • Consumption of • Meters: 2 W each – 578 GWh/year; • Home gateway (ADSL – sharable with other functionalities): 5.35 W – 1547 GWh/year;
Energy footprint of ICT – 5 • Consumption of • Sensors/actuators, 10 elements per home (could be much more): • based on Low speed power line: 10 × 2 W each – 5780 GWh/year; • based on ZigBee: 10 × 0.25 W each – 723 GWh/year; • Displaying device: 3 W – 867 GWh/year; • no standby mode considered, as all devices today are expected to be always on. • In this scenario, overall consumption per household could range between ~13 and ~30 W in the worst case, which results in ~3.7 – ~8.7 TWh per year. • By assuming a figure of 2500 kWh/year for a typical household, the range above would correspond to a 4.5% to 10.5% energy consumption increase for each customer.
Energy footprint of ICT – 6 Technical considerations, all networking technologies
Energy footprint of ICT – 7 • Both at • device level • whole network level (energy-aware traffic engineering) Estimated energy saving in 2015-2020 perspective telecommunication networks by the ECONET project – Telecom Italia use case. • The path towards a Green ICT includes: • Re-engineering of devices’ hardware • energy-efficient silicon; • reduction of complexity. • Dynamic adaptation of performance • power scaling; • low-power idle. • Smart standby states • proxying network presence; • virtualization.
Smart grids in different economies • Electricity is a key driver for economic development and social wellness. • Disparity among different countries is evident in • production of electricity; • grid infrastructures. • Most developing countries have power grids with limited coverage and low efficiency. • In many developing countries just a very small part of the population has access to the electrical grid! • The need for “Just” Grid.
Smart grids in different economies – 2 World electricity generation from 1971 to 2009 by region (TWh). (Asia does not include China.) Regional electricity system use and loss of electricity
Smart grids in different economies – 3 Regional power pools in Africa (Maghreb power pool is not shown). High voltage transmission grid in Europe.
Smart grids in different economies – 4 • Smart Grids have the potential to fill the gap • sustainable and low-cost production of electricity through large integration of renewables; • microgrids and islanding mode of operation for rural areas; • improvement of efficiency by grid monitoring; • reliable and cheaper supply of electricity by demand-response mechanisms; • new business models to address specific needs of low-income customers and reduce administrative costs related to meter readings and billing.
Key issues, challenges and opportunities for ICT • Modern paradigms often rely on rich and flexible data description and transmission • may turn into major transmission delays, network load and latency, • could lead to unacceptable performance for time-critical applications. • Coexistence of multiple technologies • wireline offers higher performance, but with higher deployment costs (remote areas), • wireless provides cost-effective solutions, yet with worse performance and some limitations to reach underground installations; further, interferences are likely for unlicensed technologies. • Survivability of the telecommunication network to blackouts • needed to enable automatic and prompt recovery from failures of the electrical grid, • guaranteed through back-up batteries and diesel generators • lifetime of many hours (or even a day) in central offices, but few hours in small installations • limited by technical, economical and environmental factors.
More information Contact: Cristina Bueti (greenstandard@itu.int) http://www.itu.int/ITU-T/climatechange/