Download
1 / 28
280 likes | 397 Views
Chronic Illness in a Complex Health Economy: The Perils & Promises of Downstream & Upstream Reforms. Jack Homer, Gary Hirsch, and Bobby Milstein International System Dynamics Conference Boston, Massachusetts July 29 – August 2, 2007. The U.S. Health Care Quandary. A puzzle:

E N D
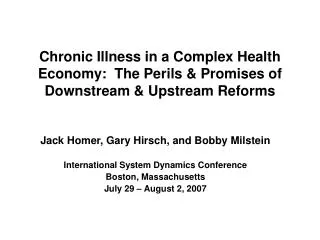
Chronic Illness in a Complex Health Economy: The Perils & Promises of Downstream & Upstream Reforms Jack Homer, Gary Hirsch, and Bobby Milstein International System Dynamics Conference Boston, Massachusetts July 29 – August 2, 2007
The U.S. Health Care Quandary • A puzzle: • U.S. has world’s highest healthcare costs • But our health and longevity are only mediocre for a developed country • How did this happen? • Some preliminary thinking (causal loops) • CDC’s Health Systems Workgroup 2003 • SD Society’s Health Policy Special Interest Group 2005 • To build a solid theory, need to look at data series • Healthcare spending & price inflation • Disease & risk prevalence and deaths • Health insurance coverage • Health care assets & investments
Health Care Spending and Self-reported Prevalence of Impaired Health 1982-2004 (National Health Expenditure Accounts, National Health Interview Survey)
Disease Care (Downstream) Loops B3. High costs lead to less insurance, inhibiting disease mgmt R1. Revenues reinvested B1. Dis Mgmt reduces complications B2. High costs lead to less reimbursement, inhibiting investment R2. Care prolongs life, increases demand R3. “Tug of war” leading to price inflation
Downstream What-Ifs (1960-2010) • What if employers didn’t cut insurance? Extent of care improved, but health care costs increased. • What if providers didn’t raise their fees? Costs reduced, insurance increased, so greater extent of care. • However, a fixed-price policy threatens provider autonomy, and may trigger a decline in supply of providers • What if payers didn’t restrict reimbursements? Investments and assets increased, so greater extent of care. Also, providers don’t feel need to raise their fees, so costs reduced and insurance increased, so even greater extent of care. • However, private payers may not trust providers to “play fair”, and will fear an explosion in wasteful spending and investment • Conclusion: In U.S. system, hard to find a politically acceptable way to limit costs but also encourage beneficial investments.
Risk & Disease Prevention (Upstream) Loops B6. Health protection $ linked to risk prevalence (“sin taxes”) B4. Risk mgmt $ linked to downstream $ B5. Health protection $ linked to downstream $
Upstream What-Ifs (1960-2010) • What if the risk management portion of non-urgent care were doubled? Less onset of disease and lower downstream costs, with a payback time of 15 years. • What if (starting 1980) $5 were spent on health protection for every $100 of downstream spending? Even greater reduction in disease onset and downstream costs, but with a payback time of 22 years. • A longer payback time because health protection acts further upstream than risk management • But cost data reflect only direct costs of care, not productivity losses; Whatcom County models (SDR 2004) show payback time much shorter when productivity losses taken into account • Conclusion: Even in the dysfunctional U.S. system, progress to reduce costs and improve health through upstream measures is possible…but will require commitment and political will.
But health-related quality of life has worsened 14% increase Source: Centers for Disease Control and Prevention. Health-related quality of life: prevalence data. National Center for Chronic Disease Prevention and Health Promotion, 2003. Accessed March 21 at <http://apps.nccd.cdc.gov/HRQOL/>.
Upstream work is a very small fraction of health spending Upstream Prevention and Protection ----------------------------------- Total 3% Downstream Care and Management -------------------------------- Total 97% Brown R, Elixhauser A, Corea J, Luce B, Sheingod S. National expenditures for health promotion and disease prevention activities in the United States. Washington, DC: Battelle; Medical Technology Assessment and Policy Research Center; 1991. Report No.: BHARC-013/91-019.
Becoming no longer vulnerable General Vulnerable Population Population Becoming Afflicted Becoming Afflicted with Afflicted vulnerable without Complications Complications Developing Complications Dying from Complications CENTERS FOR DISEASE CONTROL & PREVENTION Upstream and Downstream in the Health System SAFER • HEALTHIER • PEOPLE ™ Gerberding JL. Protecting health—the new research imperative. JAMA 2005; 294(11): 1403-1406. Levins R, Lopez C. Toward an ecosocial view of health. Intl J Health Svcs 1999; 29(2):261-293.
Prevalence of cardiovascular risk factors 1991-1999 (National Health Interview Survey)
Health insurance coverage 1987-2004 (US Census)
Healthcare structures & equipment investment and estimated asset value 1960-2004 (in year 2000 dollars per capita)
Medical doctors 1980-2004 (in thousands) Healthcare assets also include human capital, in the form of doctors, nurses, and other trained personnel. The number of MDs grew somewhat more slowly than did S&E assets, helping to explain why a shortage of medical personnel has developed.
Anti-hypertensive & anti-cholesterol drug spending per capita 1980-2004
Population death rate from coronary heart disease, 1950–1998 0.6% 0.5% 0.4% 0.3% Age-adjusted Death Rate 0.2% 0.1% 0% 1950 1950 1960 1970 1980 1990 2000 Year Marks JS. The burden of chronic disease and the future of public health. CDC Information Sharing Meeting. Atlanta, GA: National Center for Chronic Disease Prevention and Health Promotion; 2003.
Consumer Price Indices for Health Care and the General Economy 1960-2004 (1960=1)
Key Calibration Assumptions Allowing a Good Fit to History (1960-2004) • Revenue reinvestment rate started at 13-14% in the 1960s, but in reaction to higher costs declined to 10% in 1980, and 6% by 2004. • Government-insured fraction of those not privately insured rose from 18% in 1960, to 37% in 1970, to 45% in 1975, to 48% in 1990, to 50% in 2000. • Reduction in care due to no insurance coverage is 60% for urgent/rehab care and 85% for disease management. • Risk onset rate due to adverse behaviors and living conditions increased by 30% from 1980 to 1995, and by another 5% through 2005. • This pattern corresponds well to apparent pattern of caloric intake driving the rise in U.S. obesity since late 1970s. See Homer/CDC obesity model presented at ISDC 2006.
Simulation versus Historical Data (1) Consumption-sim Sim Consumption-data (1) Data (3) Investment-sim Investment-data (2) Total-sim Sim Total-data (5) Data (4) Private-sim Private-data (6)
Simulation versus Historical Data (2) Risk-data (7) Sim Risk-sim Data (9) Disease-sim Disease-data (8) Data sources: (1 & 3) Consumption: NHEA personal health care spending, 1960-2004 annual, divided by pop and by GDP deflator (2000=1); (2) Investment: NHEA investments in structures and equipment, 1960-2004 annual, divided by pop and by GDP deflator; (4) Price: BLS medical care CPI (1960=1) divided by general economy CPI (1960=1), 1960-2005 annual; (5 & 6) Insured: Census fraction of pop all ages covered by private or govt health insurance, 1987-2005 annual; (7) Risk prevalence: BRFSS fraction adults report at least one of five cardiovascular risk factors, 1991-1999 odd years; (8) Disease prevalence: NHIS fraction pop all ages report health as good, fair, or poor (i.e., not excellent or very good), 1982-2004 annual; (9) Deaths: NVSR total deaths per year divided by pop, 1960-1980 every 5 years, 1980-2003 annual.
Test Results for Downstream What-ifs Insured fraction of popn Healthcare assets per capita 1 6,000 No reimburse down 0.95 4,500 No coverage down No price up No price up 0.9 3,000 No cover down No reimburse down Base Base 0.85 1,500 0.8 0 1960 1965 1970 1975 1980 1985 1990 1995 2000 2005 2010 1960 1965 1970 1975 1980 1985 1990 1995 2000 2005 2010 Time (year) Time (year) Healthcare costs per capita Urgent episodes per capita 8,000 0.18 No coverage down 6,000 0.16 Base No coverage down Base 4,000 0.14 No reimb. down No price up No price up 2,000 0.12 No reimburse down 0 0.1 1960 1965 1970 1975 1980 1985 1990 1995 2000 2005 2010 1960 1965 1970 1975 1980 1985 1990 1995 2000 2005 2010 Time (year) Time (year)
More health protection Base More risk mgmt More risk mgmt More health protection Base No obesity up No obesity up Base Base More risk mgmt More risk mgmt More health protection More health protection No obesity up No obesity up Test Results for Upstream What-Ifs Upstream spending per capita Fraction of popn with disease 400 0.4 300 0.35 200 0.3 100 0 0.25 1960 1965 1970 1975 1980 1985 1990 1995 2000 2005 2010 1960 1965 1970 1975 1980 1985 1990 1995 2000 2005 2010 Time (year) Time (year) Healthcare costs per capita Urgent episodes per capita 0.18 8,000 0.16 6,000 0.14 4,000 0.12 2,000 0.1 0 1960 1965 1970 1975 1980 1985 1990 1995 2000 2005 2010 1960 1965 1970 1975 1980 1985 1990 1995 2000 2005 2010 Time (year) Time (year)