1 / 2

Maryland Intoxication Death Rates 2007-2012

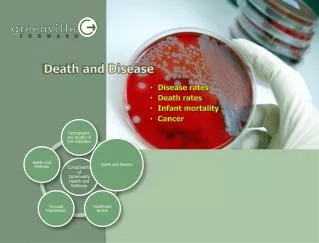
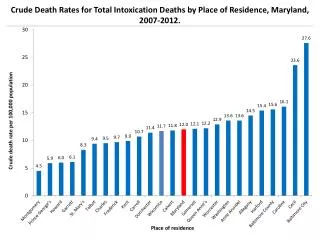
Explore age-adjusted death rates for total intoxication deaths by place of residence in Maryland from 2007 to 2012. Discover trends and statistics for reliable data jurisdictions with 20 or more deaths over the period.

domani
Download Presentation

Maryland Intoxication Death Rates 2007-2012

An Image/Link below is provided (as is) to download presentation Download Policy: Content on the Website is provided to you AS IS for your information and personal use and may not be sold / licensed / shared on other websites without getting consent from its author. Content is provided to you AS IS for your information and personal use only. Download presentation by click this link. While downloading, if for some reason you are not able to download a presentation, the publisher may have deleted the file from their server. During download, if you can't get a presentation, the file might be deleted by the publisher.

E N D

Presentation Transcript


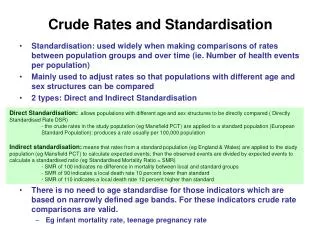
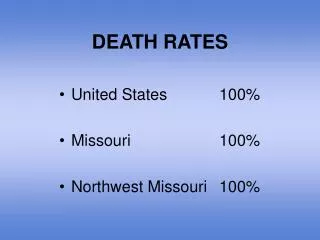
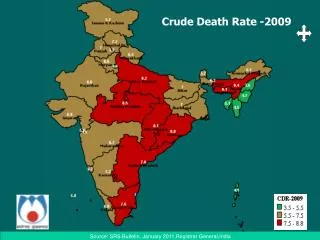
  1. Crude Death Rates for Total Intoxication Deaths by Place of Residence, Maryland, 2007-2012.

  2. Age-Adjusted Death Rates1,2 for Total Intoxication Deaths by Place of Residence, Maryland, 2007-2012. 1Age-adjusted to the 2000 U.S. standard population 2Since age-adjusted rates based on fewer than 20 deaths are considered unreliable, rates are only shown for jurisdictions with 20 or more intoxication deaths over the six-year period.

More Related