Download
1 / 25
250 likes | 312 Views
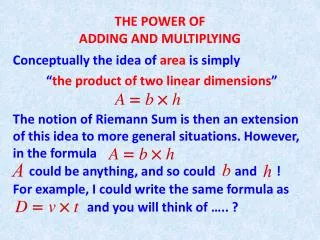
Means, variations and the effect of adding and multiplying. Textbook, pp. 373-74. Adding and multiplying . The text is on p. 373 is not tremendously clear on what’s happening here. Let’s see if we can clarify by giving an example .

E N D
Means, variations and the effect of adding and multiplying Textbook, pp. 373-74
Adding and multiplying • The text is on p. 373 is not tremendously clear on what’s happening here. Let’s see if we can clarify by giving an example. • You will need to use you TI 83 or 84 calculator. Detailed instructions are presented on the slides. Make sure that your answer matches those on the display.
Outline • We are going to add, subtract, and multiply a series of six numbers. • We will calculate the mean, standard deviation, and variance of the series and compare the results. • Hopefully this will make the text material clearer. • The series is 4 6 7 8 10 13 • Starting on the next slide, we will enter this series and then start manipulating it. The skills in using the calculator are important for further work in this course. • As always, this PowerPoint is available on the Garfield web site.
Quick review (in case you’ve forgotten about lists!) • Press the STATS button, and you should get something like this • Press ENTER to get the list • Enter the data, pressing ENTER between each item, and each should appear in the list
Add, subtract, and multiply X using the list function of the TI 83/84 • L1 now contains 6 numbers that we’ll use to compare mean (μ), standard deviations (σ) and variance (var) • First, let’s manipulate X (the numbers you just entered) to show what happens when we add to, subtract from, or multiply a random variable
Finding and clearing what’s already in L2 • Highlight L2 atop the column using the cursor keys. I’ve left some junk in here to show you how to clear it out. • Next, press the CLEAR key to eliminate what’s in L2. You won’t see it disappear immediately, but the cursor moves to the bottom and is ready to receive data.
Reminder on how to enter L1, L2, L3 etc. into formulas on the TI 83/84 • Press the “2nd” key (yellow on TI 83, blue on TI 84) • While depressing the “2nd” key, depress the “1” key on the keypad. • This gives you L1. To get L2, L3, L4, etc., depress the 2, 3, or 4 key, respectively
L2: how to add 6i.e., L2=X+6 • You can add 6 to an existing list easily. • Insert L1 by following the instructions on the previous slide • Now, enter “+6” after the inserted L1 and you’re just about ready to go
Getting to L2=L1+3(in stat-talk, Y=X+6) • Press the ENTER key and you should see everything in L2 replaced • Check these values against L1, and each should be 6 more than its corresponding entry in L1 (green double arrows)
L3: subtracting 3i.e., X-3 • Let’s make List 3 (L3) three less than L1, i.e., each value in L3 is 3 less than the corresponding entry in L1 • How to do: enter L3=L1-3 (repeat what we just did with L2, except on L3) • You should end up with something that looks like the bottom screen on the left, with each entry being 3 less than the corresponding data in L1
L4: multiply by 3i.e.,3X • Let’s make List 4 (L4) three times L1; each value in L3 is 3 times as large as the corresponding entry in L1 • Clear L4 as before and enter L4=3*L1, and press ENTER • Here’s a comparison of L4 with L1, except I copied L1 into L5. L4 should be 3 times larger than the entries in L5
Now, to calculate μ, σ, and var(mean, standard deviation, and variance) • Push the STAT button to get the Statistics menu • Use the cursor buttons to select the CALC menu at the top • As soon as you move the cursor to CALC, you will see the following menu
Calculating statistics variables • Press the ENTER key and you will get a blank screen like this • Enter L1 to determine the which list you want the statistics on (press 2nd, followed by the 1 key on the keypad as entered earlier • Now press ENTER, and we’ll see what we get on the next slide
Output from 1-VAR STATS • After pressing ENTER, your screen should look like this • μ=8, which the TI lists as • So where’s the VAR? • Even if we scroll down, we only find median, max, min and IQR data
Relation between standard deviation (σ) and variance (var) • VAR = σ2 • For TI calculators, the standard deviation calculated by 1-VAR STATS is the Sx variable • Here, σ = Sx = 3.16227766 • σ2 in this cases therefore equals 10 (3.1622772) • (Note that is therefore a good approximation of π)
What next? • We are going to be making a table to compare for each of L1, L2, L3, and L4 • You need to set up a table that looks like the one to the right, with appropriate labels • Make a table like this one in your notes, and we’ll get the relevant statistics for you to fill in
Running 1-VAR STATS on L2 Do the same as we did on L1 • Select 1-VAR STATS after going to STAT and CALC • Press ENTER while outlining 1-VAR STATS • Add “L2” in the blank screen (press “2nd” key and “2” on the keypad simultaneously)
Results for running 1-VAR STATS on L2 • And you should get the equivalent of what we got before (see screen at left). • Enter the data for μ, σ (Sx), and VAR in the table you created in your notes • Remember to calculate VAR by squaring σ (Sx in the TI) • (Notice what has changed and what hasn’t)
Results for L3 and L4 • Repeat for L3 and L4. • You should get screens like this for L3.... • ….and like this for L4 • Be sure to copy all the relevant data into the table, and don’t forget to square Sxto get VAR
Comparison of results of calculations on L1, L2, L3, and L4 • What stays the same as X is reduced or increased by addition or subtraction? • What happens when we multiply? (e.g., L4) • How does this correlate with what you read in the text?
Explanation of calculations on L1, L2, L3, and L4 • Increasing or decreasing X does not change σ • Multiplying X by 3 triples σ • Multiplying X by 3 increases the VAR by 9, or 32 (variance increases by the square of multiplier)
Summary of adding and multiplying X, means, standard deviation, and variances • E(X±c)=E(X)±c • Var(X±c)= Var(X) • E(aX)=aE(X) • Var(aX)=a2Var(X)
Let’s put the equations into words before we move on • E(X±c)=E(X)±c • Var(X±c)= Var(X) • If we change a random variable simply by adding or subtracting a constant, we simply add the constant to the mean of X • Having changed a random variable in this way, the variance DOES NOT CHANGE
Let’s put the equations into words before we move on • E(aX)=aE(X) • Var(aX)=a2Var(X) • If we change a random variable by multiplying it by a constant, the new mean is simply the constant times the original mean before multiplication • When we change a random variable by multipying by a constant, the variance increases by the square of the constant
So why do we even care? Answer: to save ourselves a LOT of work • If we add or subtract from X, we don’t have to recalculate ANYTHING. • The variance doesn’t change (nor does the standard deviation, since σ=VAR½ • The mean increases by whatever we added or subtracted • If we multiply X by a constant a, the new mean is just a times the original mean, and the VAR is now the old VAR times the square of the constant a (i.e., multiply VAR by a2) • THIS MEANS WE DON’T HAVE TO DO ANY LABORIOUS CALCULATIONS! </end of slide show>