Designing Samples
Designing Samples. Section 5.1. Non-Probability Samples. There are several types of samples in which the choice of participants does not rely on some element of probability. These include but are not limited to: Convenience Sample Volunteer Sample Judgement Sample. Non-Probability Samples.


Designing Samples
E N D
Presentation Transcript
Designing Samples Section 5.1
Non-Probability Samples • There are several types of samples in which the choice of participants does not rely on some element of probability. These include but are not limited to: • Convenience Sample • Volunteer Sample • Judgement Sample
Non-Probability Samples • Convenience Sample • The participants in a convenient sample are convenient to the researcher • They may or may not accurately reflect the population of interest • We may not be able to generalize information gathered from this sample to the intended population • If used, the sample must be very clearly and accurately described
Non-Probability Samples • Volunteer Sample • Participants have volunteered to be part of the study • Individuals who volunteer are usually different than the general population • Many times individuals who volunteer have strong negative feelings about an issue
Non-Probability Samples • Judgement Sample • The researcher chooses the individuals for the sample • This type of sample is only as good as the researcher’s judgement
Bias • Bias is a systematic favoring of one outcome over another • When samples are chosen using methods that do not include an element of probability, the likelihood that the sample is biased is great. • Great care must be taken when making generalizations to populations any time a non-probability sample is taken.
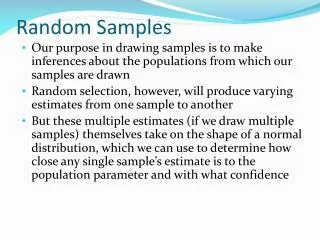
Probability Samples • Although we can never guarantee that a sample is representative of a population, we have a better chance for generalization using samples that are chosen using probability
Types of Probability Samples • Simple Random Sample • Every individual has an equally-likely chance of being chosen • Every sample of size “n” has an equally-likely chance of being chosen
Types of Probability Samples • Stratified Random Sample • Population is divided into groups by a common characteristic • Random samples are then taken from each group. • The proportion of each group (strata) in the sample should mirror the proportion each group (strata) is in the population.
Types of Probability Samples • Cluster Sample • Population occurs in natural groups • Groups are randomly selected • All individuals within the randomly selected group become part of the sample.
Types of Probability Samples • Systematic Random Sample • Population is divided into groups of equal size. • The number of groups is the same as the sample size • One individual is then chosen from the first group.
Types of Probability Samples • Multi-stage Sample • Random samples are taken of first of large groups, then smaller groups until a random sample of individuals are taken. • Ex: Randomly choose 10 states • Randomly choose 10 cities from each of the 10 states • Randomly choose 20 individuals from each of the 10 cities
Using Random Digits to select a sample • One way to select individuals from a population is to use random digits • One way to generate a random digit table would be to put all ten digits in a hat, draw one out, record it, put it back in the hat, mix, and repeat until you have a table of digits. • Usually random digit tables are generated using a computer which can complete a table in seconds • Our calculator can also generate “pseudo” random digits---it is “pseudo” because it actually uses an algorithm, but will be random enough for our purposes • Let’s look at each of the types of probability samples and use random digits to choose our sample
Open Lunch • South High School used to have an open lunch policy where students could go off campus to eat lunch. • The campus has been closed for several years now and the administration would like to get student opinions on the lunch policy • You are asked to use your statistical knowledge to select a sample of 100 students to take the survey.
Sampling • The first thing we need for any of the probability samples is a sampling frame. • A sampling frame is simply a list of every individual in the population. • For our situation that shouldn’t be too difficult, we’ll just run a school roster. • Since we are going to use random digits to choose our sample, we need to assign each individual a number. • Since there are 1386 students at South High School, we need to assign a 4-digit number to each individual---that way when we use the table everyone has an equally-likely chance of being chosen.
Rules for assigning numbers to populations • If the population numbers • Pop ≤ 10 can assign using 1-digit “0 – 9” • 10 < pop ≤ 100 use 2-digits “00 – 99” • 100 < pop ≤ 1000 use 3-digits “000 – 999” • 1000 < pop ≤ 10000 use 4-digits “0000 – 9999” • Ect…. • Using these guidelines for numbering the sampling frame will ensure that all individuals have an equally-likely chance of being chosen
Simple Random Sample • We will number our individuals from 0001 – 1386. • We’ll first look at how to use the random digit table • We will choose the first six individuals for our sample.
The Table • The random digit table is set up in groups of 5 digits. The only reason for this is to make the table easier to read. • We will look at 4 digits at a time beginning on line 101 to choose the first six individuals for our sample Individuals chosen for Sample 1922 3405 8713 3950 7562 9640
Using the TI to choose our sample • From the home screen • MATH • PRB • 5:RandInt(0001,1386,6) • The first argument in the parentheses (0001) is the starting number, the second argument (1386) is the ending number, the 3rd argument (6) is how many random numbers you want to generate. *Note: although the leading zeros are not necessary, they will help to remind you that each individual in the population must be numbered with the same number of digits.
Changes for other Sampling Methods • Systematic Random Sample • We may decide that we want to ensure that all grade levels are represented in our sample so instead of taking a simple random sample we can take a stratified random sample • This only changes a few things in our sampling plan
Stratified Random Sample • Let’s assume that in our population of students we have • 275 Seniors approx 20% • 348 Juniors approx 25% • 367 Sophomores approx 26% • 396 Freshmen approx 29% • We want the percentages that each of the classes make up in the population to be mirrored by the classes making up that same percentage in the sample
Stratified Random Sample • This means that instead of taking the same number from each class, we will take the following to make up our total sample of 100 • 20 Seniors • 25 Juniors • 26 Sophomores • 29 Freshmen
Stratified Random Sample • Now assign numbers to the individuals in each class and then take random samples in the same way we previously did • Seniors use 001 – 275 • Juniors use 001 – 348 • Sophomores use 001 – 367 • Freshmen use 001 - 396
Cluster Sample • Instead of numbering each individual student, we will number all the 3rd hour classrooms. • We can then randomly choose say 4 of them (assuming the average class size is 25) and every individual in each of the classrooms chosen becomes part of our sample.
Systematic Random Sample • To illustrate this type of sampling we need the number in our population to be a multiple of our preferred sample size, so we will assume that we have had some new enrollments and our total student population is 1400 • The first step in this design is to divide our population into the number of groups we want to have in our sample
Systematic random Sample • Since we want n=100, we will divide our population into 100 groups. This means that each group will have 140 students (1400/100) • Number each individual in each group from 001 – 140 (Since each group has 140 individuals in it) • Randomly choose 1 number between 001 -140. This number indicates the individual in each of the groups that become part of the sample. For example: If the number 97 is chosen then the 97th individual in each of the 100 groups is part of the sample.
Multi-stage Random Sample • For a multi-stage random sample we might: • Randomly choose 2 hours of the day • Randomly choose 5 classrooms in each of the 2 hours previously chosen (a total of 10 classrooms) • Randomly choose 10 individuals from those in the previously chosen classrooms (total sample size 100)
Additional Resources • The Practice of Statistics—YMM • Pg 249-261 • The Practice of Statistics—YMS • Pg 270-285 • Against All Odds—Video #14 • http://www.learner.org/resources/series65.html