Download
1 / 25
250 likes | 343 Views
GE Smart Grid Survey. June, 2010. Table of Contents. Background & Methodology Key Findings Detailed Findings Demographic Trends Demographic Profile. Background & Methodology.

E N D
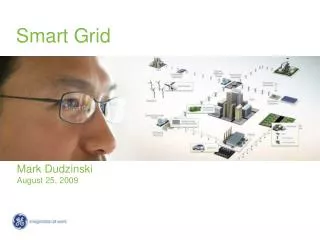
GE Smart Grid Survey June, 2010
Table of Contents • Background & Methodology • Key Findings • Detailed Findings • Demographic Trends • Demographic Profile
Background & Methodology • As a follow up to the March 2010 Smart Grid study, GE and Edelman have partnered with StrategyOne to conduct research in order to further understand how smart meters and smart grids are increasingly becoming a divisive topic among Americans. • Based on one’s level of knowledge, demographics, and lifestyles, consumers are primed to become either advocates or antagonists. It is important to gain a greater understanding about who makes up each of these groups, how they’re influenced, and what emotional and psychological responses are triggered by the smart grid debate, particularly as it relates to consumers’ personal perceptions and behaviors, as well as those relating to their patriotism.
Background & Methodology • In order to include a national and regional perspective, StrategyOne conducted a six-question omnibus survey among a census representative sample of: • US Consumers • Sample size: n=1,000 • Methodology: telephone • Interviews were conducted in June, 2010. • The margin of error for the sample of US consumers (n=1,000) is + 3.1% at the 95% level of confidence.
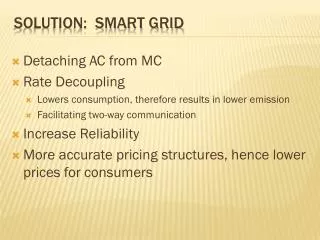
Americans recognize the importance of updating the country’s energy infrastructure • Nearly three-quarters (72%) of Americans think how we generate and use energy today could harm the economic growth of this country. • A full 88% think money spent on making capital improvements to today’s energy infrastructure is necessary.
And consumers are willing to do their part to assist, through changing their usage habits • The vast majority (79%) of adults report that I’m willing to adjust my energy consumption habits and behaviors in the short-term, even if it is difficult, for me to support developing and deploying long-term solutions to America’s energy challenges. • 88% admit they are willing to use a smart device such as a meter, thermostat, appliance, etc. if it would help to better manage their energy usage. • Further, 82% of those adults willing to use smart devices believe smart meters and smart appliances are the future.
Yet, many Americans remain unsure of their role and are wary of drastic changes • 51% admit that saving money is more important to me than convenience or energy conservation. • Nearly half (46%) believe that beyond controlling my own energy (i.e. turning off lights, keeping the A/C temperature at 78, etc.), I don’t think there is much more I can do to support “green”/sustainable energy platforms. • And Americans believe it is important for energy companies to invest in infrastructure as well, as 70% agree I’d prefer my power company invest to make the current infrastructure better than build a new power plant.
Americans overwhelmingly agree that investing in energy infrastructure improvements is essential Agree NET: 88% Q1. For the following statements, please tell me if you strongly agree, somewhat agree, somewhat disagree or strongly disagree with each statement.
The majority see energy as an area that could either greatly help or harm America… Q2, Q3. For the following statements, please tell me if you strongly agree, somewhat agree, somewhat disagree or strongly disagree with each statement.
…And many see changes to their energy consumption – or lack thereof – as fundamentally against their rights as Americans Q3. For the following statements, please tell me if you strongly agree, somewhat agree, somewhat disagree or strongly disagree with each statement.
Most consumers are willing to change their daily habits, in order to effect change… Q2. For the following statements, please tell me if you strongly agree, somewhat agree, somewhat disagree or strongly disagree with each statement.
…And nearly all say they’re willing to use smart appliances to do so Willing NET: 88% Not Willing NET: 10% Q4. How willing would you be to use a smart device such as a meter, thermostat, appliance, etc. if it would help you better manage your energy usage?
Americans are most motivated to use smart appliances by a desire to save money and gain control Base: Those who are willing to switch (n=884) Q5. Which, if any, of the following would drive you to use a smart device such as a meter, thermostat, appliance, etc. once a smart grid is available in your community?
Those who aren’t willing to use smart appliances tend to view them as more expensive or a risk to their privacy Solution not optimal Unwilling to change Lack of knowledge Base: Those who are not willing to switch (n=97) Q6. For which, if any, of the following are you unwilling to use a smart device such as a meter, thermostat, appliance, etc.?
However, many Americans don’t feel like they can make a difference, or are unwilling to risk price increases to do so Beyond controlling my own energy (i.e. turning off lights, keeping the A/C temperature at 78, etc.), I don't think there is much more I can do to support "green"/sustainable energy platforms 46% Agree NET 51% Agree NET Saving money is more important to me than convenience or energy conservation Q1. For the following statements, please tell me if you strongly agree, somewhat agree, somewhat disagree or strongly disagree with each statement.
And the majority would prefer that the current infrastructure be updated, rather than replaced Agree NET: 70% Q1. For the following statements, please tell me if you strongly agree, somewhat agree, somewhat disagree or strongly disagree with each statement.
Gender Trends • Women are significantly more likely than men to agree that how we generate and use energy today could harm the economic growth of this country (75% vs. 68% men). • Men are significantly more likely than women to believe that it is “un-American” for the power company to influence any changes in my energy consumption habits (42% vs. 33% women). • However, women who are willing to use a smart device are significantly more likely than their male counterparts to say that patriotism would drive them to start using a smart device, once a smart grid is available in their community (60% vs. 49% men).
Age Trends • Adults age 65+ are significantly more likely than any other age group to believe that beyond controlling my own energy, for example, turning off lights, keeping the A/C temperature at 78, etc., I don’t think there is much more I can do to support “green” or sustainable energy (36% age 18-34, 37% age 35-44, 46% age 45-54, 54% age 55-64, 65% age 65+). • Adults age 18-34 are significantly more likely to prefer their power company invest to make the current infrastructure better than build a new power plant (82% age 18-34, 68% age 35-44, 63% age 45-54, 68% age 55-64, 67% age 65+). • They’re also more likely to be willing to use a smart device if it would help them better manage their energy usage (95% age 18-34, 91% age 35-44, 88% age 45-54, 87% age 55-64, 81% age 65+). • Interestingly, adults age 35-44 are significantly more likely to believe that it is “un-American” for me to resist new ways of thinking about my energy consumption habits (36% age 18-34, 56% age 35-44, 38% age 45-54, 41% age 55-64, 46% age 65+).
Regional Trends • Northeasterners are significantly more likely to disagree that saving money is more important to me than convenience or energy conservation (50% Northeast, 36% Midwest, 38% South, 37% West). • Southerners significantly believe that it is “un-American for the power company to influence any changes in my energy consumption habits (45% South, 31% Northeast, 38% Midwest, 30% West).
Parents Trends • Non-parents are significantly more likely to believe that beyond controlling my own energy, for example, turning off lights, keeping A/C temperature at 78, etc., I don’t think there is much more I can do to support “green or sustainable energy (51% Non-parents vs. 38% Parents).
Demographic Profile Gender Male: 48% Female: 52% Age 18-34: 30% 35-44: 18% 45-54: 19% 55-64: 14% 65+: 17% Ethnicity White: 67% African-American: 13% Hispanic: 13% Region Northeast: 19% Midwest: 22% South: 36% West: 22% Income Less than $35,000: 26% $35,000-$49,999: 11% $50,000-$74,999: 19% $75,000-$99,999: 8% $100,000 or more: 15% Don’t know/Refused: 14%