Download
1 / 8
80 likes | 169 Views
Learn the importance of data buy-in, timely data collection, and utilizing dashboards to identify trends and improvement opportunities. Discover strategies to engage staff, create effective dashboards, and streamline reporting processes for better decision-making.

E N D
Analyze Data, Utilization of Dashboards and Data to Identify Improvement Opportunities Andrew P. Hoskins Program Support, ADPCS VA Illiana Healthcare System Danville, IL 61832 217-554-4309 Andrew.hoskins@va.gov
Need for Data, The Buy in. • The First step to successful data collection is what I call the buy in. You have to have everyone’s support of supplying required data or it will not work. With this you have to provide a simplistic, yet effective tool for them to utilize for data entry. You also have to provide an end product that tells the story of what is currently going on at your facility. • I always say I am only as good as the Data I receive. Accurate and timely data is the only way you will get the full picture of what is going on at your facility. Without data we cannot Identify potential problems, trends, or statistics that ultimately may affect patient care, and your bottom line. • How do I insure that I get timely data? • I set deadlines that need to be met usually 5 days (If not completed I am standing at their desk, I only had to do this once per department, but my size may have been a reason I get reports on time.) prior to my actual due date so that I have time to repair reports, analyze data to identify trends, possible issues and provide my interpretation of data to Executive Staff. • In order to get the buy in you have to provide tools that are easily utilized, and take the least amount of time for Chiefs, Department Heads, Admin Officers, etc, yet get the data you need to provide accurate interpretations. • You also have to be able to provide data interpretation in a form that everyone can interpret.
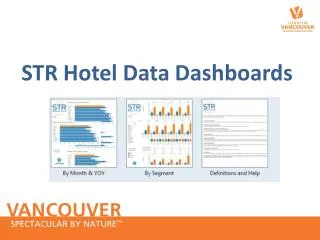
Got the Buy in • So I was asked to create a dashboard for our services in ADPCS by the Associate Director, my boss. • Okay, my first thought what is a dashboard? • Just kidding I have seen a dashboard its in my car. • About now you are thinking Death by Power Point. • Please stay with me as I am getting to the good stuff. • Okay, what is a dashboard? • A one stop shop to analyze and showcase your data. Instead of taking 25 reports to the morning or afternoon meeting you only need one. Ahhhh, caught your attention now. • 25 Reports = 1 Dashboard. By creating links from source data all you have to do is input data on source reports, open dashboard, update, print, present, done.
The Buy In • THE BUY IN REQUIRES STAFF FROM THE FRONT LINES TO THE EXECUTIVE STAFF. • You have to provide accurate interpretation and provide different views of the same data so that the audience understands the story your data is telling them. • Some people look at percentages and get the story, some look at number comparisons and get the story, and some utilize both to understand the story. • I personally like raw number comparison myself, but we all have are preferences. • So my goal today is to hopefully show you ways to get the buy in, improve data collection, create a dashboard and get you ready to present a finished product that will catch the eye of all staff. I wanted to make a simplistic format everyone could understand, enter, and interpret data. So I got to work and created my first dashboard. Senior Executives reviewed it and liked it so well they implemented it as standard format throughout the facility. Hmmm, maybe I should not have done such a good job, Now my workload has just increased. But not by much as I have a template, just change labels, Services input data, work with development of what services want, include all required reporting, print, present, done.
The Ultimate Buy in • Assuming Most of you have Microsoft Office Products. • Your facility will not have to purchase at Retail Dashboard Program. • Excel works perfectly, it may not be as pretty of purchased software, but I think you will find that the ultimate overall product is just as impressive easier to utilize, and provides the same data. • It is not going to cost your facility anything, as the original investment has already been made. • You are most likely already being paid, if not you might think you have a job but your employer does not know you are an employee. • Anyway enough death by PowerPoint. Lets get to it and show you how I got the buy in and how you can get your buy in.
Why do should I create a Dashboard? • By creating one single format Dashboard, everyone can be on the same page. • It is easier to interpret the data if the format is the same. • Less overall cost to the bottom line by reducing copies of multiple reports • Reduced Man-hours needed to complete reports by linking all feeder reports to dashboard. (Caution only link reports that you own or have formatted yourself, of which the source format does not change) You can give access to your departments to input data into the dashboard if source reports format change frequently) • Can be placed on Share Drive to allow access to Users (I would recommend limiting access to those that need it) • Can be placed on Share Point or Facility Webpage for ease of access and distribution of data. • Multiple sources can input data onto dashboard. (Nurse Managers, Admin, ETC) • Better overall understanding of the data you are presenting. • If you don’t have to fumble through your reports for your presentation, plain and simple it just makes sense. Get the information out quickly and effectively and reduce time at meetings, you should be sold just on this as most of us spend a lot of time in meetings. • Having one report to cover multiple meetings is a win, win.
Data/Graphs/Dashboard/Present • Guide to Dashboard Development • -Collect Data: From all sources, already in place. • -Create Dashboard: one stop shop. • -Create Graphs: that catch the attention of Audience. • -Analyze Data • -Present Data Findings • -Complete • Dashboard Examples