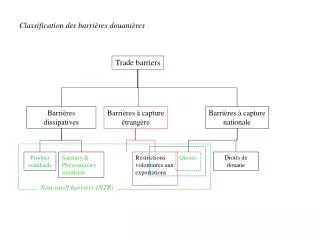
Download

1 / 80
800 likes | 954 Views
Welfare Implications of Trade Barriers. Chapter 14. Consumer Surplus. A demand curve represents willingness to pay by demanders Demand curves array these different individuals’ preferences in order of their willingness to pay. Consumer Surplus. P. Demand for Shania Twain

E N D
Welfare Implications of Trade Barriers Chapter 14
Consumer Surplus • A demand curve represents willingness to pay by demanders • Demand curves array these different individuals’ preferences in order of their willingness to pay
Consumer Surplus P Demand for Shania Twain tickets (or anything else) is downward-sloping. Those who are most willing to pay appear on the upper part of the curve; those less willing to pay are lower on the curve D Q
Consumer Surplus P Suppose the price of a Shania Twain ticket is P* P* D Q
Consumer Surplus P So the first consumer gets a deal: he or she is willing to pay P1, but only has to pay P* P1 P* D Q
Consumer Surplus P The first consumer gets a surplus equivalent to the shaded area P1 P* D Q
Consumer Surplus P The second consumer is willing to pay a bit less, P2. But he or she still makes out well, since the actual market price is only P* P2 P* D Q
Consumer Surplus P The second consumer receives a surplus equivalent to the shaded region. Each consumer who purchases this product gets a little surplus. P2 P* D Q
Consumer Surplus P All of the individuals’ surpluses can be added together to form a measure of consumer well-being. CS is the area between the demand curve and the price. P* D Q
Consumer Surplus • If the price rises, CS gets smaller and consumers are worse off
Consumer Surplus P P* D Q
Consumer Surplus P If the price rises to P*1, CS falls to the area of the green triangle, reflected diminished consumer well-being P*1 P* D Q
Consumer Surplus P The yellow shaded area is the loss in consumer surplus P*1 P* D Q
Consumer Surplus • If the price falls, CS gets larger and consumers are better off
Consumer Surplus P P* D Q
Consumer Surplus P If the price falls to P*1, consumer surplus rises. Consumers are better off. P* P*1 D Q
Producer Surplus • A supply curve arrays suppliers in order according to their marginal costs • The first firm on the supply curve has the lowest marginal cost, the second firm has the second-lowest marginal cost, etc.
Producer Surplus P S Supply is upward-sloping. Those firms with the lowest MC appear on the lower part of the supply curve; those suppliers with higher MC are farther up Q
Producer Surplus Suppose the market price is P* P S P* Q
Producer Surplus So the first supplier gets a deal: he or she is able to charge P*, but only incurs costs of P1 P S P* P1 Q
Producer Surplus The first supplier receives a surplus (like profit) equal to the area of the shaded rectangle P S P* P1 Q
Producer Surplus When we add together the first supplier’s surplus to the second’s (and all the others) we get total producer surplus (PS) P S P* PS is the area between the price and the supply curve. It is a measure of overall well- being of producers Q
Changes in PS • PS rises when the price rises • PS falls when the price falls
Tariffs: A Welfare Analysis • What happens when a country imposes a tariff? Its domestic price rises • We know from before that tariffs: • benefit domestic producers • harm domestic consumers • generate tariff revenue for the government • What’s the overall effect on the domestic economy? Could a tariff ever increase a country’s welfare?
Tariffs: A Welfare Analysis P S Suppose the free trade price is $1; 1000 units are imported $1 D 2000 Q 1000
Tariffs: A Welfare Analysis P S A 35% tariff raises the price to $1.35, lowering imports to 500 units $1.35 $1 D Q 1250 2000 1750 1000
Tariffs: A Welfare Analysis P S CS declines by the shaded area $1.35 $1 D Q 1250 2000 1750 1000
Tariffs: A Welfare Analysis P We can quantify this: the area of the rectangle is (1750)*.35 = $612.50 The triangle’s area is .5(.35)250 = $43.75. Thus we can calculate total CS loss as $656.25. S $1.35 $1 D Q 1250 2000 1750 1000
Tariffs: A Welfare Analysis P S Meanwhile, PS rises by the shaded area $1.35 $1 D Q 1250 2000 1750 1000
Tariffs: A Welfare Analysis Again, this is quantifiable: the area of the rectangle is (1000*.35) = $350. The area of the triangle is (.5)(250)(.35) = $43.75. The total gain to producers is $393.75 P S $1.35 $1 D Q 1250 2000 1750 1000
Tariffs: A Welfare Analysis To recap: the loss in CS is bigger than the gain in PS, so we are faced with an overall loss equivalent to the shaded area: P S $1.35 $1 D 1000 1250 Q 2000 1750
Tariffs: A Welfare Analysis Happily, some of this loss is recaptured in the form of tariff revenue P S Tariff revenue = 500*.35 = $175 $1.35 $1 D 1000 1250 Q 2000 1750
Tariffs: A Welfare Analysis What remains is called deadweight loss (DWL): society is worse off by the area of the two DWL triangles P S $1.35 $1 D 1000 1250 Q 2000 1750
Tariffs: A Welfare Analysis DWL = (.5)(250)(.35) + (.5)(250)(.35) = $87.50 P S $1.35 $1 D 1000 1250 Q 2000 1750
Deadweight Loss • One can calculate DWL by • figuring out the area of the two triangles, or • summing the loss in CS, the gain in PS, and the gain in tariff revenue • You should get the same answer either way!
DWL Loss in CS: -$656.25 Gain in PS: $393.75 Gain in revenue: $175.00 =================== DWL: -$ 87.50 Note: this is the same number we calculated before
Tariffs: Larger Countries • In the previous analysis, the tariff caused the imposing country’s price to rise by the full amount of the tariff • This would mean that the imposing country is “small”; if it imposes a tariff, it is unable to affect the world price • What if a country is not “small”?
Tariffs: Larger Countries S P P S PICA PECA D D Q Q Exporting Country Importing Country
Tariffs: Larger Countries S P P S PICA PFT PECA D D Q Q Exporting Country Importing Country
Tariffs: Larger Countries S P P Tariff causes price to fall in exporting country Tariff causes price to rise in imposing country S PFT D D Q Q Exporting Country Importing Country
Tariffs: Larger Countries S P P Imports fall Exports fall S PFT D D Q Q Exporting Country Importing Country
Tariffs: Larger Countries S P P CS falls S PFT D D Q Q Exporting Country Importing Country
Tariffs: Larger Countries S P P PS rises S PFT D D Q Q Exporting Country Importing Country
Tariffs: Larger Countries S P P Tariff revenue is created S PFT D D Q Q Exporting Country Importing Country
Tariffs: Larger Countries S P P Revenue paid by imposing-country consumers S PFT D D Q Q Exporting Country Importing Country
Tariffs: Larger Countries S P P Revenue paid by exporters S PFT D D Q Q Exporting Country Importing Country
Tariffs: Larger Countries • After we account for the loss in consumer welfare:
Tariffs: Larger Countries S P P CS falls S PFT D D Q Q Exporting Country Importing Country
Tariffs: Larger Countries • After we account for: • the loss in consumer welfare, and • the gain in producer welfare
Tariffs: Larger Countries S P P PS rises S PFT D D Q Q Exporting Country Importing Country