Download
1 / 59
590 likes | 603 Views
Explore the thriving economy of the High Desert region, with a focus on job growth, population trends, manufacturing, construction, healthcare, and office markets. Discover the potential for economic expansion and competitive advantages in this dynamic area.

E N D
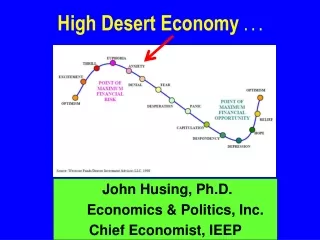
High Desert Economy . . . John Husing, Ph.D. Economics & Politics, Inc. Chief Economist, IEEP
After Losing 8.71 Million Jobs … Now At A Record Level of JobsU.S. Jobs Long Slow Growth - Not Over-Heating
California Job Gains/Losses Up 1,064,038 6.7% Up 2007 15,844,325 2016 16,908,363 Recovery 2,243,097 Great Recession -1,179,058
Inland Empire Population Greater Than 25 of 50 States 2010-2016 Growth: 6.2%
High Desert Population In Cities 349,249 2010-2016 Growth: 6.0%
Gold Mine Theory Secondary Tier Primary Tier
Value of the Dollar:Helps Imports & Hurts Exports 100.0 2012-2016 25.6%
Port Container VolumesOn Pace To Tie 2nd Highest Import Level
Net Industrial Space Absorption 17.1 million
Industrial Vacancy Rate Low Everywhere! 2005/2006 2009Q3 2016Q4 High Desert 5.0% Inland Empire 2.7% 12.8% 4.0% San Diego 7.0% 12.0% 3.6% Central Valley NA NA 1.9% Orange Co. 5.4% 6.5% 1.6% L.A. Co. 2.1% 3.2% 1.2% Source: CB Richard Ellis & Coldwell Banker
Industrial Asking Lease Rates Soaring High Desert $5.88 Up 17.5%
Logistics Powerful Job Growth • 2011-2016 • 23.1% of New Jobs • Median Pay $45,456
Inland Empire Manufacturing Jobs • 2011-2016 • 5.5% of Job Growth • Median Pay $50,106
High Desert Existing Home Prices 104% -31%
High Desert New Home Prices 74% -27%
Mortgage Market Has Stabilized …Low Numbers of Notices of Default
Apartment Rental Rates & Vacancies. Riverside $1,367 4.6% San Bernardino $1,418 3.9% Orange $1,637 3.4% Santa Barbara $1,682 2.7% San Diego $1,873 3.2% Ventura $1,890 3.9% Los Angeles $2,180 4.0% Source: CB Richard Ellis
Inland Empire Construction Jobs • 2011-2016 • 12.8% of Job Growth • Median Pay $51,915
Potential Impact On Health Care Demand & Quality of Life -51.0% Drop in Uninsured
Health Care Jobs: Continuous Growth • 2011-2016 • 11.6% of Job Growth • Median Pay $59,494
High Paying Sectors Ahmad Adel Al-Khatib Jack Dangermond
Office Market Vacancies Improving 24.2% 12.4%
Office Vacancy Rates Recovering But Remain High! 2006Q4 2009Q4 2016Q4 Ventura NA NA 16.6% Inland Empire 7.6% 22.6% 12.5% L.A. Co. 9.4% 14.1% 12.4% Central NA NA 11.9% San Diego 10.1% 18.0% 11.5% Orange Co. 7.3% 18.7% 9.7% High Desert 5.8% Source: CB Richard Ellis & Coldwell Banker
Office Asking Lease Rates Rising Down -8.2% High Desert $1.40
Professionals & Mgmt., Higher Ed., Mining Utilities, Information Group Slowly Adding Jobs 2011-2016 0.4% of Growth Median Pay $71,206
Assessed Valuation Finally, Purchasing Power Growth! 14.1% FY 2009-2018 Inflation: 11.7%
High Desert Assessed Valuation -10.2% SB Co. +14.1%