Download
1 / 20
200 likes | 454 Views
Use of commercial grade light emitting diode in auto-correlation measurements of femtosecond and picosecond laser pulses at 1054 nm. Speaker: Tzung Da Jiang Adviser : Dr. Ja -Hon Lin. Outline. Introduction Theoretical background

E N D
Use of commercial grade light emitting diode inauto-correlation measurements of femtosecond andpicosecond laser pulses at 1054 nm Speaker: TzungDaJiang Adviser : Dr. Ja-Hon Lin
Outline • Introduction • Theoretical background • Characterization of AlGaAs LEDs for non-linear photo-current • Real time auto-correlation of laser pulses • Conclusion
Introduction • The generation of ultra-short laser pulses [1]and their applications [2] require reliable measurementpulse parameterslike : • duration • shape • frequency chirp • Laser pulses are generally characterized using auto-correlation methods based on second harmonic generation (SHG) in non-linear crystals followed by a linear detector : • Photo-multiplier tube (PMT) • charge coupleddevice (CCD) cameras [1] T. Kobayashi, A. Baltuska, Meas. Sci. Technol. 13 (2002)1671. [2] G.A. Mourou, C.P.J. Barty, M.D. Parry, Phys. Today 51 (1998) 22.
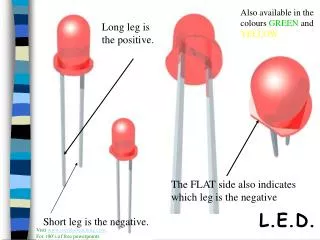
Advantages of semiconductor detector • Two-photon absorption (TPA) in commercial grade semiconductor deviceshas drawn considerable interest as a substitute for quadratic intensity response of SHGin certain non-linear crystals. • The advantages of the semiconductor photodiodes and light emitting diodes are : • Available off-the-shelf and are quite inexpensive • Relatively insensitiveto incident light polarizationand wavelength • Does not require any phase matching condition • Non-hygroscopic • Their optical and electrical properties are integrated in a single unit • No spectral filtering effects
Introduction • In this paper, we present the characterization: • Use AlGaAs based LED as TPA detector for autocorrelation measurement. • Measurements of 200 fsand 30 ps laser pulses at 1054 nm wavelength. • We have investigated: • Measure lifetime of the LED. • Measure pulseduration and small amount of frequency chirp. • Modify IAC signals enhance twofold sensitivity for detection chirp. • Use time calibration method to estimate the pulse duration and the frequency chirp. • Discuss different time calibration methods about their suitability.
Theoretical background • The two-photon absorption based induced photo-current (ITPA) may be described as : • (ampere/watt²) : the two-photon induce photo-current response • P : the pulse peak power • In a practical situation, for two-photon absorption the condition of TPA (2h > Eg > h) is necessary, but not sufficient. • The response may vary linearly, if • impurities • defects present in the semiconductor diode
Signal of two-photon absorption • The two- photon induced current in a semiconductor diode as a function of relative time delay () between the two pulses, would then represent the second order auto-correlation function S2() • k : the intensity ratio of the two beams • E(t) = [I(t)]½ exp[i(t)] : the electric field • I(t) : the pulse intensity envelope function • (t) is the phase function
Signal of two-photon absorption • The above auto-correlation may also be expressed in the form, where and The phase function may be expressed in the form, • : linear chirp • : quadratic chirp • : cubic chirp • p: FWHM duration
Advantage of MOSAIC • Though the IAC signals are widely used to detectand estimate thefrequency chirp in laserpulses, they are not very sensitive tothe magnitude and order of chirp : • The technique of modified spectrum autointerferometric- correlation (MOSAIC) can enhance the sensitivity toward the presence of the frequency chirp.The reason is: • The envelope functionG2(s) and F22(s) can be very useful in sensitivedetection. • chirp-free pulses : E(t) and E*(t) are same • chirped pulses : E(t) and E*(t) are different
Principle of MOSAIC • MOSAIC signal generated from S2() by filtering out the cos0 term and increasing the weight factor of the cos20 term by a factor of two, can be expressed as • The locus of the interference minima of this signalexpressed below: g2 and f22 are the normalized G2(s) andF22(s)
Two-photon induced responsewith 30 ps laser pulse • Pulseduration : 30ps • Peak emission wavelength:660nm • Oscillator : 100 MHz cw mode-locked Nd:fluorophosphate • Pump : single-shot, flash lamp • From the log–log plots (with slope 2) in (a), it is clearly seen that the induced photo-current varies quadratically for a substantial range of incident laser power. • The output current got saturated at 0.8 A.
Two-photon induced responsewith 200 fs laser pulse • Pulseduration : 200fs • Peak emission wavelength:660nm • Oscillator : 100 MHz cw mode-locked Nd:fluorophosphate • pump : single-shot, flash lamp • From the log–log plots (with slope 2) in (a), it is clearly seen that the induced photo-current varies quadratically for a substantial range of incident laser power. • No such effect was observed for 200 fs laser pulses upto an output of 1.0 A for an average power of 80 mW.
Two-photon induced response for different bias voltages • It is observed that while the response increases with bias voltage, its quadratic nature remains the same. • This is perhaps due to the fact that the capacitance of the LED junction becomes smaller in the reverse bias condition
Estimate its life-time as a two-photon detector • The lifetime in this case is defined as the number of laser pulses after which the photo-current reduces to half the initial value. • It is clearly seen that the induced photocurrent decreases with an increase in the number of laser pulses . • decreases slowly:(1.2 kW pulsed, 24 mW average, 21011 lifetime ) • decreases faster :(3.5 kW pulsed, 70 mW average , 61011 lifetime ) • It may be mentioned here that, the decrease in photo-current with laser exposure is not due to any drift of the alignment condition of the incident laser beam on the LED. Normalised LED signal Number of laser pulses
Experimental setup • Pulse width:200 fsand 30 ps • wavelength :1054 nm • LED materal:AlGaAs based
Determine the pulse duration • FWHM of IAC signal:165(mv) • FWHM spatial width: 165(mv)*0.78(m/mv)=129(m) • FWHM temporal width= • The actual laser pulse duration: 205fs (FWHM)
Determine the actual pulse duration • Parameter: • Wavelength: 1054nm • Fringe number:98 • temporal duration of IAC signals : • FWHM: 981054 10^-9/3 10^8=345(fs) • Pulse duration: 345/1.92=180(fs) • The number of fringes over a fixed time interval remains the same at different temporal locations of the IAC signal, even if the response of the delay line is non- linear.
Detect the frequencychirp • Using fast Fourier transformand appropriate digital filtersderived the envelope functiong2 and f22 • The peak amplitude of the difference signalwas 0.06, which corresponds to an estimateof linear chirp () of 0.20. Autocorrelation signal Ramp signal time(s)
Intensity auto-correlation of multi-picosecondlaser pulses • Parameter: • Pulse duration :30ps • Pulse energy :20J • Output: Pulse duration :33ps • Issue: • Need larger amount of pulse energy. • Use higher pulse energy, device may get damaged.
Conclusion • The intensity response is observed to be quadratic over a wide range of incident laser intensity range. • The lifetime of the LED has been estimated at two different intensity exposure levels. • The LED has been used to determine • pulse duration • small amount frequency chirp • Suitability of these LEDs to record intensity auto-correlation in multi-picosecond regime is demonstrated using 30 ps laser pulses.