Download
1 / 16
160 likes | 183 Views
Learn to perform t-tests on related groups, compute t-values, interpret results, and determine significance in Chapter 11.

E N D
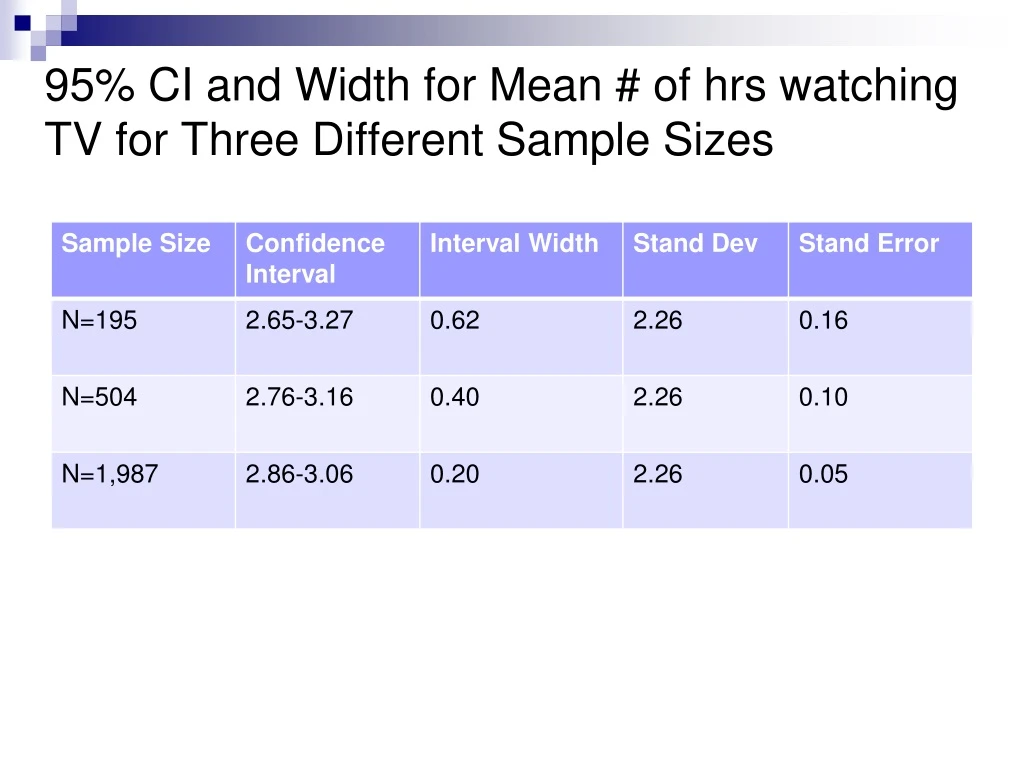
95% CI and Width for Mean # of hrs watching TV for Three Different Sample Sizes
Part IVSignificantly DifferentUsing Inferential Statistics Chapter 11 t(ea) for Two (Again) Tests Between the Means of Related Groups
What you will learn in Chapter 11 • When to use a t test for independent means • How to compute the observed t value • Interpreting the t value and what it means
t Tests for Dependent Samples • Determining the correct statistic
Computing the Test Statistic • Numerator reflects the sum of the differences between two groups
Degrees of Freedom • Degrees of freedom approximate the sample size • Degrees of freedom can vary based on the test statistic selected • For this procedure… • n – 1 (where n is the number of observations)
Doing the t testSteps in the process • Step 1: • Calculate • Step 2: • Calculate
Doing the t testSteps in the process • Step 3: • Count the number of scores in each group. • N1 = # scores in Group 1. • N2 = # scores in Group 2.
Doing the t testSteps in the process • Step 4: • Calculate sample variance for both groups Step 5: Do the math!! Be sure to solve within brackets first!!
Significance testingSteps in the process • Step 1: • Calculate the degrees of freedom • N1 + N2 – 2 • Step 2: • One- or two-tailed test of significance? • Did you have a directional hypothesis or not?
Significance testingSteps in the process • Step 3: • Using the table, find the critical values of t using N1 + N2 – 2 degrees of freedom. • Page 353-355, the t distribution. • Step 4: • Compare the obtained t with the critical value of t.
So How Do I Interpret… • t(24) = 2.45, p > .05 • t represents the test statistic used • 24 is the number of degrees of freedom • 2.45 is the obtained value (from the formula) • p > .05 indicates the probability
Using the Computer • SPSS and Pared Samples t Test
SPSS Output • What does it all mean?


