Download

1 / 43
430 likes | 450 Views
Learn the distinctions between discrete Binomial, Poisson, and continuous Normal distributions, sample problems, Chi-squared tests, and properties of these fundamental statistical concepts.

E N D
Three discrete distributions Proportional Poisson Binomial
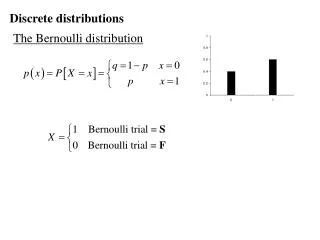
Given a number of categories Probability proportional to number of opportunities Days of the week, months of the year Proportional Number of successes in n trials Have to know n, p under the null hypothesis Punnett square, many p=0.5 examples Binomial Number of events in interval of space or time n not fixed, not given p Car wrecks, flowers in a field Poisson
Proportional Binomial Binomial with large n, small p converges to the Poisson distribution Poisson
Examples: name that distribution • Asteroids hitting the moon per year • Babies born at night vs. during the day • Number of males in classes with 25 students • Number of snails in 1x1 m quadrats • Number of wins out of 50 in rock-paper-scissors
Proportional Generate expected values Calculate 2 test statistic Binomial Poisson
Sample Null hypothesis Test statistic Null distribution compare How unusual is this test statistic? P > 0.05 P < 0.05 Reject Ho Fail to reject Ho
Chi-squared goodness of fit test Null hypothesis: Data fit a particular Discrete distribution Sample Calculate expected values Chi-squared Test statistic • Null distribution: • 2 With N-1-p d.f. compare How unusual is this test statistic? P > 0.05 P < 0.05 Reject Ho Fail to reject Ho
Normal distribution • A continuous probability distribution • Describes a bell-shaped curve • Good approximation for many biological variables
The normal distribution is very common in nature Human body temperature Human birth weight Number of bristles on a Drosophila abdomen
Discrete probability distribution Continuous probability distribution Normal Poisson Probability Probability density Pr[X=2] = 0.22 Pr[X=2] = ? Probability that X is EXACTLY 2 is very very small
Discrete probability distribution Continuous probability distribution Normal Poisson Probability Probability density Pr[1.5≤X≤2.5] = Area under the curve Pr[X=2] = 0.22
Discrete probability distribution Continuous probability distribution Normal Poisson Probability Probability density Pr[1.5≤X≤2.5] = 0.06 Pr[X=2] = 0.22
Normal distribution Probability density x
Normal distribution Probability density x Area under the curve:
A normal distribution is fully described by its mean and variance
A normal distribution is symmetric around its mean Probability Density Y
About 2/3 of random draws from a normal distribution are within one standard deviation of the mean
About 95% of random draws from a normal distribution are within two standard deviations of the mean (Really, it’s 1.96 SD.)
Properties of a Normal Distribution • Fully described by its mean and variance • Symmetric around its mean • Mean = median = mode • 2/3 of randomly-drawn observations fall between - and + • 95% of randomly-drawn observations fall between -2 and +2
Standard normal distribution • A normal distribution with: • Mean of zero. (m = 0) • Standard deviation of one. (s = 1)
Standard normal table • Gives the probability of getting a random draw from a standard normal distribution greater than a given value
Standard normal table: Z = 1.96 Pr[Z>1.96]=0.025
Normal Rules • Pr[X < x] =1- Pr[X > x] Pr[X<x] + Pr[X>x]=1 + = 1
Standard normal is symmetric, so... • Pr[X > x] = Pr[X < -x]
Normal Rules • Pr[X > x] = Pr[X < -x] • Pr[X < x] =1- Pr[X > x]
Sample standard normal calculations • Pr[Z > 1.09] • Pr[Z < -1.09] • Pr[Z > -1.75] • Pr[0.34 < Z < 2.52] • Pr[-1.00 < Z < 1.00]
What about other normal distributions? • All normal distributions are shaped alike, just with different means and variances
What about other normal distributions? • All normal distributions are shaped alike, just with different means and variances • Any normal distribution can be converted to a standard normal distribution, by Z-score
Z tells us how many standard deviations Y is from the mean The probability of getting a value greater than Y is the same as the probability of getting a value greater than Z from a standard normal distribution.
Z tells us how many standard deviations Y is from the mean Pr[Z > z] = Pr[Y > y]
Example: British spies MI5 says a man has to be shorter than 180.3 cm tall to be a spy. Mean height of British men is 177.0cm, with standard deviation 7.1cm, with a normal distribution. What proportion of British men are excluded from a career as a spy by this height criteria?
m = 177.0cm s = 7.1cm y = 180.3 Pr[Y >y]
Part of the standard normal table Pr[Z > 0.46] = 0.32276, so Pr[Y > 180.3] = 0.32276
Sample problem MI5 says a woman has to be shorter than 172.7 cm tall to be a spy. The mean height of women in Britain is 163.3 cm, with standard deviation 6.4 cm. What fraction of women meet the height standard for application to MI5?