Download
1 / 1
10 likes | 168 Views
Magda Mandić 1 ( mmandic@phy.uniri.h r) , Andrej Mihevc 2 , Albrecht Leis 3 , Ines Krajcar Bronić 4 1 Department of Physics, University of Rijeka, Rijeka, Croatia; 2 Karst Research Institute, Postojna, Slovenia;

E N D
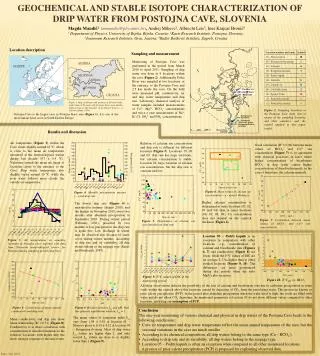
Magda Mandić1 (mmandic@phy.uniri.hr), Andrej Mihevc2, Albrecht Leis3, Ines Krajcar Bronić4 1 Department of Physics, University of Rijeka, Rijeka, Croatia; 2Karst Research Institute, Postojna, Slovenia; 3Joanneum Research Institute, Graz, Austria; 4Ruđer Bošković Institute, Zagreb, Croatia Sampling and measurement Monitoring of Postojna Cave was performed in the period from March 2010 to April 2011. Sampling of drip water was done at 9 locations within the cave (Figure 2). Additionally Pivka River was sampled at two locations: at the entrance to the Postojna Cave and 2.5 km inside the cave. On the field were measured pH, conductivity, air and drip water temperature and drip rate. Laboratory chemical analysis of water samples included measurements of Ca2+, Mg2+, HCO3- concentrations and twice a year measurement of Na+, K+,Cl-, SO42- and NO3- concentrations. Locationdescription Figure 1. Map of Europe with position of Slovenia (left); (right) map of Slovenia with Postojna Karst area (darker shadowed area). The boundary of the Dinaric karst (- - -) is shown (Gams, 1974). Figure 2. Sampling locations in the Postojna Cave (left). List of names of the sampling locations and their numbers, and the symbol applied in this paper (right) • Postojna Cave is the largest cave in Postojna Karst area (Figure 1). It is one of the most famous karst caves in South Eastern Europe. Results and discussion • Relation of calcium ion concentration and drip rate is different for different locations (Figure 5). Locations 07, 08 and 09: drip rate has large variations, but calcium concentration is stable. Location 02: large variation of calcium ion concentration,but the drip rate is constant and low. • Air temperature (Figure 3) within the Cave varies slightly around 10 ºC, which is close to the mean air temperature measured at the meteorological station during last decade (9.7 ± 0.5 ºC). Variations around the mean are larger at locations closer to the entrance to the Cave. Drip water temperature also slightly varies around 10 ºC, while the river water follows more closely the outside air temperature. • Good correlation (R2 = 0.94) between mean values of HCO3- and Ca2+ionconcentration (Figure 7)is in agreement with classical processes in karst where higher concentrations of bicarbonate HCO3- in drip water causes higher concentrations of dissolved minerals, in the case of limestone, the calcium minerals. Figure 4. Monthly precipitation amount (—) and drip rate Figure 6. Mean values of calcium ion concentration vs. caprock thickness. Higher calcium concentration is determined at outer locations (01, 02, 03 and 04)than at innerlocations (06, 07, 08, 09). Ca concentration does not depend on the caprock thickness (Figure 6). The lowest drip rate (Figure 4) is measured in summer (August 2010), and the highest in November 2010, about two months after abundant precipitation in September 2010. During winter period (February 2011), preceded by two months of low precipitation, the drip rate is again low. Low discharge in winter may be observed also because of snow cover during winter months. According to drip rate and its variability, all drip waters belong to the seepage type (Smart and Friederich, 1987). GEOCHEMICAL AND STABLE ISOTOPE CHARACTERIZATION OF DRIP WATER FROM POSTOJNA CAVE, SLOVENIA Figure 7. Correlation between mean values of HCO3- and Ca2+ ion concentration Figure 5. Dependence of calcium ion concentration on drip rate Location 05 – Podrti kapnik is an exception in comparison with other locations, e.g., concentrations of calcium and bicarbonate ions (Figures 6, 7) and conductivity (Figure 8) are lower, while the d13C values of DIC are on average 2-3 ‰ higher than at other studied locations (Figure 9, 10). The differences are more pronounced during dry periods when the ratio Mg/Ca also increases. Figure 3. Air temperatures on sampling locations in Postojna cave, together with data from Slovenian meteorological survey for Postojna during sampling period (step line) Figure 9. d13C values of DIC in the monitoring period Figure 10. d13CDIC vs. HCO3- All these observations indicate the possibility of the loss of calcium and bicarbonate ions due to carbonate precipitation in some voids within the caprock above this locations caused by degassing of CO2 from the percolating water. This process in known as prior calcite precipitation (PCP). In the period after abundant precipitation when the water level is high, the voids are filled with water and do not allow CO2 degassing, the mentioned parameters at location 05 do not show different values compared to other locations, justifying our assumption of PCP. Figure 8. Correlations of mean annual conductivity and drip rate Figure 9. Relation between Isat and pH. Red line presents equilibrium solution, Isat = 1. Conclusion The one-year monitoring of various chemical and physical in drip waters of the Postojna Cave leads to the following conclusions: • Cave air temperature and drip water temperature reflect the mean annual temperature of the area, but the seasonal variations in the cave are much smaller • According to its chemical composition, all drip waters belong to the same type (Ca – HCO3-). • According to drip rate and its variability, all drip waters belong to the seepage type. • Location 05 – Podrti kapnik is often an exception when compared to all other monitored locations. • A process of prior calcite precipitation (PCP) is proposed for explaining observed data. The mean values of saturation index Isat vary from 1.94 ± 0.81 at location 01 – Slonova glava to 6.19 ± 4.12 at location 04 – Kongresna dvorana. Most of drip water Isat values are higherthan 1, and only several Isat values are close to or slightly lower than 1(Figure 9). Mean conductivity and drip rate show linear relationship (R2 = 0.51) (Figure 8). Conductivity is in direct correlation with concentration of dissolved minerals in the solution. Locations with higher drip rate show stronger response to the rain events. Brno, July 2013.