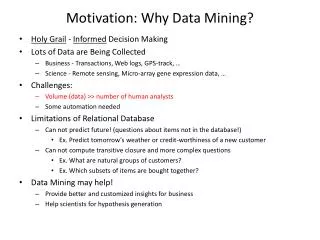
Motivation: Why Data Mining ?
Motivation: Why Data Mining ? . Holy Grail - Informed Decision Making Lots of Data are Being Collected Business - Transactions, Web logs, GPS-track, … Science - Remote sensing, Micro-array gene expression data, … Challenges : Volume (data) >> number of human analysts

Motivation: Why Data Mining ?
E N D
Presentation Transcript
Motivation: Why Data Mining? • Holy Grail - Informed Decision Making • Lots of Data are Being Collected • Business - Transactions, Web logs, GPS-track, … • Science - Remote sensing, Micro-array gene expression data, … • Challenges: • Volume (data) >> number of human analysts • Some automation needed • Limitations of Relational Database • Can not predict future! (questions about items not in the database!) • Ex. Predict tomorrow’s weather or credit-worthiness of a new customer • Can not compute transitive closure and more complex questions • Ex. What are natural groups of customers? • Ex. Which subsets of items are bought together? • Data Mining may help! • Provide better and customized insights for business • Help scientists for hypothesis generation
Motivation for Data Mining • Understanding of a (new) phenomenon • Discovery of model may beisaided by patterns • Ex. 1854 London: • Cholera deaths clustered around a water pump • Narrow down potential causes • Change Hypothesis: Miasma => Water-borne • Though, final model may not involve patterns • Cause-effect e.g. Cholera caused by germs
Data Mining: Definition • The process of discovering • interesting, useful, non-trivial patterns • patterns: non-specialist • exception to patterns: specialist • from large datasets • Pattern families • Clusters • Outlier, Anomalies • Associations, Correlations • Classification and Prediction models • …
What’s NOT Data Mining • Simple Querying or summarization of Data • Find number of Subaru drivers in Ramsey county • Search space is not large (not exponential) • Testing a hypothesis via a primary data analysis • Ex. Do Subaru driver vote for Democrats ? • Search space is not large! • DM: secondary data analysis to generate multiple plausible hypotheses • Uninteresting or obvious patterns in data • Minneapolis and St. Paul have similar climate • Common knowledge: Nearby places have similar climate!
Context of Data Mining Models • CRISP-DM (CRoss-Industry Standard Process for DM) • Application/Business Understanding • Data Understanding • Data Preparation • Modeling • Evaluation • Deployment Phases of CRISP-DM http://www.crisp-dm.org
Outline • Clustering • Outlier Detection • Association Rules • Classification & Prediction • Summary
K = 2 Clustering: What are natural groups of employees?
B F 20 C K = 2 Years Of Service E 10 D A 30 40 50 Age Clustering: Geometric View shows 2 groups!
B F 20 Seed K = 2 C Seed Years Of Service E 10 D A 30 40 50 Age K-Means Algorithm: 1. Start with random seeds
B B F F 20 20 Seed K = 2 C C Seed Years Of Service Years Of Service E E 10 10 D D A A 30 30 40 40 50 50 Age Age K-Means Algorithm: 2. Assign points to closest seed Color shows closest seed
B F 20 K = 2 C Years Of Service E 10 D A 30 40 50 Age K-Means Algorithm: 3. Revise seeds to group centers Revised seeds
K-Means Algorithm: 2. Assign points to closest seed B B F F 20 20 K = 2 C C Years Of Service Years Of Service Colors show closest Seed E E 10 10 D D A A 30 30 40 40 50 50 Age Age Revised seeds
K-Means Algorithm: 3. Revise seeds to group centers B B F F 20 20 K = 2 C C Years Of Service Years Of Service Colors show Closest Seed E E 10 10 D D A A 30 30 40 40 50 50 Age Age Revised seed
K-Means Algorithm: If seeds changed then Loop back to step 2. Assign points to closest seed B F 20 K = 2 C Years Of Service E 10 D A 30 40 50 Age Colors show Closest seed
K-Means Algorithm: 3. Revise seeds to group centers B B F F 20 20 K = 2 C C Termination Years Of Service Years Of Service E E 10 10 D D A A 30 30 40 40 50 50 Age Age Colors show Closest seed
Outline • Clustering • Outlier Detection • Association Rules • Classification & Prediction • Summary
Outliers – Global and local • Ex. Traffic Data in Twin Cities • Abnormal Sensor 9
Outlier Detection • Distribution Tests • Global Outliers, i.e., different from population • Local Outliers, i.e. different from neighbors
Outline • Clustering • Outlier Detection • Association Rules • Classification & Prediction • Summary
Associations: Which Items are bought together? • Input: Transactions with Item-types • Metrics balance computation cost and statistical interpretation! • Support: probability (Diaper and Beer in T) = 2/5 • Confidence: probability (Beer in T | Diaper in T) = 2/2 • Algorithm Apriori [Agarwal, Srikant, VLDB94] • Support based pruning using monotonicity
Support threshold >= 0.5 Apriori Algorithm: How to eliminate infrequent item-sets asap?
Support threshold >= 0.5 Apriori Algorithm: Eliminate infrequent Singleton sets. Coffee Eggs Milk Bread Cookies Juice
Support threshold >= 0.5 Apriori Algorithm: Make pairs from frequent items & Prune infrequent pairs! MB MC MJ BC BJ CJ Coffee Eggs Milk Bread Cookies Juice
Apriori Algorithm: Make triples from frequent pairs& Prune infrequent triples! Support threshold >= 0.5 MBCJ No triples generated Due to Monotonicity! Apriori algorithm examined only 12 subsets instead of 64! MCJ MBC MBJ BCJ MB MC MJ BC BJ CJ Coffee Eggs Milk Bread Cookies Juice
Outline • Clustering • Outlier Detection • Association Rules • Classification & Prediction • Summary
Predict Class = Loanworthy From Other columns Learning Samples Find a (decision-tree) model to predict loanworthy ! Testing Samples
A Decision Tree to Predict LoanworthyFrom Other columns < 20K < 25 20..50K Age Salary >=25 > 50K Q? What is the decision on the new application?
Another Decision Tree to Predict LoanworthyFrom Other columns < 25 Age < 20K >= 25 20..50K Salary >=50K Q? What is the decision on the new application?
Predict Class = Loanworthy From Other columns ID3 Algorithm: Choosing a decision for Root Node -1
ID3 Algorithm: Choosing a decision for Root Node -2 Predict Class = Loanworthy From Other columns
Predict Class = Loanworthy From Other columns ID3 Algorithm: Choosing a decision for Root Node -3
Predict Class = Loanworthy From Other columns ID3 Algorithm: Choosing a decision for Root Node - 4
Predict Class = Loanworthy From Other columns Root Node : Decision is based on Salary
< 20K 20..50K Salary Root Node of a Decision Tree to Predict Loanworhty > 50K
< 20K 20..50K Salary ID3 Algorithm: Which Leafs needs refinement? > 50K
ID3 Algorithm Output: A Decision Tree to Predict Loanworthy column From Other columns < 20K < 25 20..50K Age Salary >=25 > 50K
< 20K < 5K 20..50K Acct_balance Salary >=5K Another Decision Tree to Predict LoanworthyFrom Other columns > 50K
ID3 prefer Salary over Age for decision in root node due to difference in information gain Even though the choices are comparable for classification accuracy. < 25 Age A Decision Root not preferred by ID3 >= 25
ID3 is greedy preferring Salary over Age for decision in root node. Thus, it prefers decision tress in earlier slides over following (despite comparable quality): < 25 Age < 20K A Decision Tree not preferedby ID3 >= 25 20..50K Salary >=50K
Summary • The process of discovering • interesting, useful, non-trivial patterns • from large datasets • Pattern families • Clusters, e.g., K-Means • Outlier, Anomalies • Associations, Correlations • Classification and Prediction models, e.g., Decision Trees • …
Review Quiz Consider an Washingtonian.com article about election micro-targeting using a database of 200+ Million records about individuals. The database is compiled from voter lists, memberships (e.g. advocacy group, frequent buyer cards, catalog/magazine subscription, ...) as well polls/surveys of effective messages and preferences. It is at www.washingtonian.com/articles/people/9627.html Q1. Match the following use-cases in the article to categories of traditional SQL2 query, association, clustering and classification: (i) How many single Asian men under 35 live in a given congressional district? (ii) How many college-educated women with children at home are in Canton, Ohio? (iii) Jaguar, Land Rover, and Porsche owners tend to be more Republican, while Subaru, Hyundai, and Volvo drivers lean Democratic. (iv) Some of the strongest predictors of political ideology are things like education, homeownership, income level, and household size. (v) Religion and gun ownership are the two most powerful predictors of partisan ID. (vi) ... it even studied the roads Republicans drove as they commuted to work, which allowed the party to put its billboards where they would do the most good. (vii) Catalyst and its competitors can build models to predict voter choices. ... Based on how alike they are, you can assign a probability to them. ... a likelihood of support on each person based on how many character traits a person shares with your known supporters.. (viii) Will 51 percent of the voters buy what RNC candidate is offering? Or will DNC candidate seem like a better deal? Q2. Compare and contrast Data Mining with Relational Databases. Q3. Compare and contrast Data Mining with Traditional Statistics (or Machine Learning).