Download

1 / 13
140 likes | 343 Views
Lesson 12: Percents and Tape Diagrams. Essential Question: How can we represent percents visually to help us solve problems?. Let’s Discuss…. How could a 10 x 10 square grid represent 200 people?. Each square represents 2 people. Let’s Discuss….

E N D
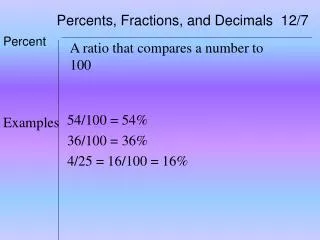
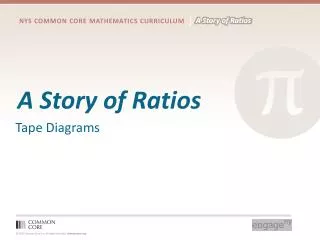
Lesson 12: Percents and Tape Diagrams Essential Question: How can we represent percents visually to help us solve problems?
Let’s Discuss… How could a 10 x 10 square grid represent 200 people? Each square represents 2 people.
Let’s Discuss… How could a tape diagram represent 200 people? What is similar and different between the two visual models?
Remember… • Tape diagram segment divisions will vary depending upon the percent. • Example: • To find 20%, it is useful to divide 100 into 5 segments; to find 10%, it is useful to divide 100 into 10 segments, etc.
Complete the tape diagram. Shade in 25% on the tape diagram where the whole represents different amounts. What fraction is represented by the tape diagram? Express the quantity in the diagram as follows: 25% of ______ = _______
Complete the tape diagram. Shade in 25% on the tape diagram where the whole represents different amounts. What fraction is represented by the tape diagram? Express the quantity in the diagram as follows: 25% of ______ = _______
Complete the tape diagram. Shade in 25% on the tape diagram where the whole represents different amounts. What fraction is represented by the tape diagram? Express the quantity in the diagram as follows: 25% of ______ = _______
Complete the tape diagram. Shade in 25% on the tape diagram where the whole represents different amounts. What fraction is represented by the tape diagram? Express the quantity in the diagram as follows: 25% of ______ = _______
Complete the tape diagram. Shade in 25% on the tape diagram where the whole represents different amounts. What fraction is represented by the tape diagram? Express the quantity in the diagram as follows: 25% of ______ = _______
Partner Work • You will be given a percent: • (such as 10%, 20%, 50%, or 75%). • 2. With your partner, label the given tape diagrams in which you must find the assigned percent of the following wholes: • 100, 200, 60, 20, 500
What pattern can you see from the fractions represented by each tape diagram?What conclusion can be drawn? • All fractions are equivalent and equal to 25% or ¼. • 25% represents different quantities (depending upon the amount of the whole).
Let’s Review… • The quantity represented by a percent depends upon the size of the whole. • Visual representations of percents are useful in solving percent problems.
Ticket to Leave In your math journal/notebook, explain why 25% does not always represent the same amount.