Download

1 / 15
170 likes | 541 Views
Food Truck . By: Team 6 . Team Members. Erin Russell: Project Manager Ann Yaacoub: Project Scheduler Evan Pope: Data Measurement Ziya Zhao: Data Analyst . Where is Cheese Wheels? . Background Information. Purdue University Dining Courts: Tom Coleman

E N D
Food Truck By: Team 6
Team Members • Erin Russell: Project Manager • Ann Yaacoub: Project Scheduler • Evan Pope: Data Measurement • Ziya Zhao: Data Analyst
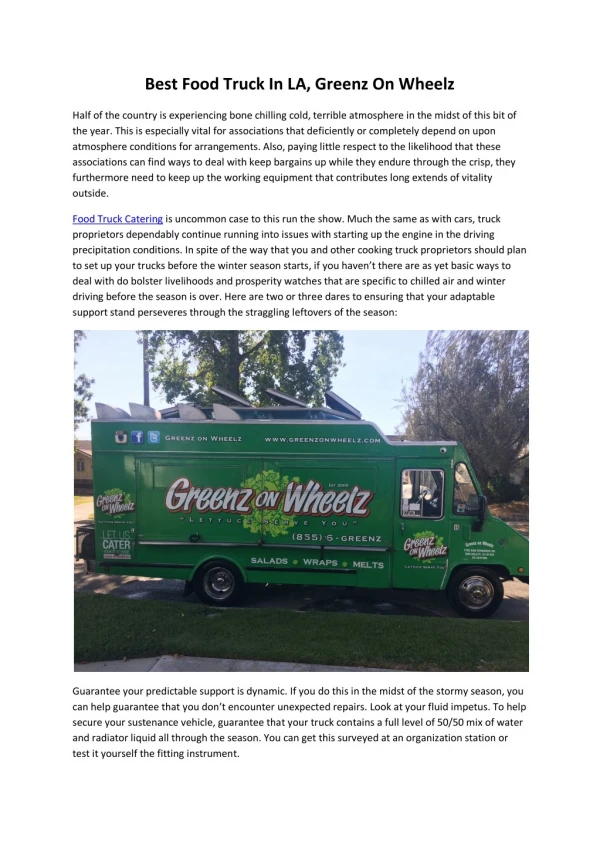
Background Information • Purdue University Dining Courts: Tom Coleman • Affordability Goal of “Establish a 5 year capital plan and to evaluate and provide new mission-centric revenue opportunities including food truck presentation, project team”. • Our Goals for this semester included: • providing optimal locations for lunch (monday-friday), night (thursday-saturday), sunday night shift, and finding optimal routes from Harrison to our optimal locations
Approach Used: Lunch and Dinner Shifts • Counted Foot Traffic: Mon-Friday (10:30-2:30PM) & Thursday-Saturday (8PM-12AM) • Minitab Regression to determine the biggest factors that determine the number of people • 6% of people will purchase food
Approach Used: Floyd-Warshall Algorithm • Nodes,Arcs, Edges • All nodes to all others • Optimal path and optimal subpath • Intermediary nodes
Approach Used: Minimax • Used the equations for C1, C2, C3, C4,C5 • Found best location with respect to Rectilinear distance (P1* & P2*)
Results: Day Shift Regression The regression equation is Number of people = 349 - 7.3 Temperature + 434 CL50 - 661 EE and Potter + 838 Time + 0.223 Temp^2 - 174 Time^2 Predictor Coef SE Coef T P Constant 348.9 443.1 0.79 0.439 Temperature -7.26 24.10 -0.30 0.766 CL50 433.8 148.3 2.93 0.008 EE and Potter -660.7 148.4 -4.45 0.000 Time 838.1 319.8 2.62 0.015 Temp^2 0.2228 0.3366 0.66 0.514 Time^2 -174.49 62.56 -2.79 0.010 S = 331.584 R-Sq = 75.9% R-Sq(adj) = 69.6%
Results: Night Shift Regression The regression equation is Response = - 217 + 21.5 Temp - 141 Time + 88.7 PMU + 175 Lawson - 0.240 Temp^2 + 22.1 Time^2 Predictor Coef SE Coef T P Constant -217.0 242.8 -0.89 0.391 Temp 21.50 15.74 1.37 0.199 Time -140.98 82.23 -1.71 0.114 PMU 88.67 31.96 2.77 0.018 Lawson 174.67 31.96 5.47 0.000 Temp^2 -0.2400 0.2130 -1.13 0.284 Time^2 22.05 16.51 1.34 0.209 S = 55.3541 R-Sq = 80.6% R-Sq(adj) = 70.0%
Results: Shortest Path Harrison to PMU: (Node 1 to Node 38):1→9→15→21→24→27→30→33→45→46→38 Total distance:21.47 Harrison to Krannert: (Node 1 to Node 38):1→9→15→21→24→27→30→33→45→46→38 Total distance:21.47 Harrison to Lawson: (Node 1 to Node 19):1→3→2→4→7→13→19 Total distance:13.5
Conclusions and Recommendations • Best locations: • CL50- Day shift • PMU sidewalk-- Night Shift • Near Meredith-- Sunday Night • Things to Consider • Special Events: Concerts, Farmers Market, Sports