Download
1 / 22
220 likes | 404 Views
Conservation Design for Sustainable Avian Populations. Modeling species occurrence dynamics at landscape levels. NC Cooperative Fish & Wildlife Research Unit, NCSU Patuxent Wildlife Research Center AL Cooperative Fish & Wildlife Research Unit, Auburn University Atlantic Coast Joint Venture

E N D
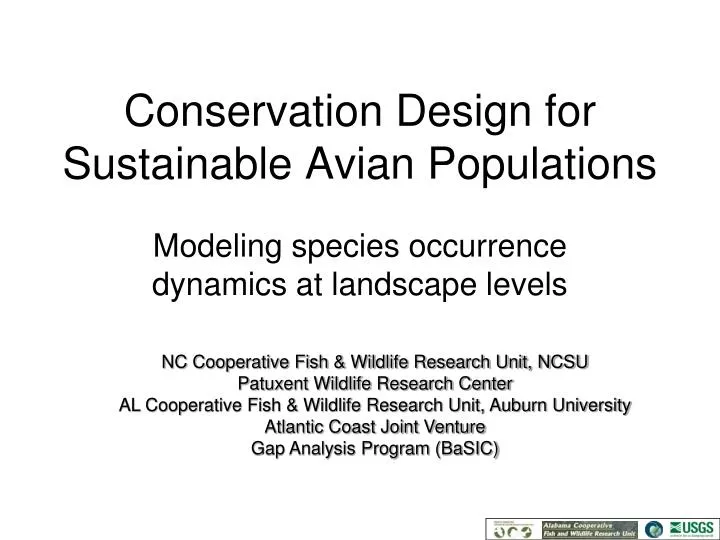
Conservation Design for Sustainable Avian Populations Modeling species occurrence dynamics at landscape levels NC Cooperative Fish & Wildlife Research Unit, NCSU Patuxent Wildlife Research Center AL Cooperative Fish & Wildlife Research Unit, Auburn University Atlantic Coast Joint Venture Gap Analysis Program (BaSIC)
Why not abundance as a starting point? Abundance…and vital rates… • BBS-derived abundance estimates cannot account/adjust for factors that affect the detection process • Availability and perception • Multiple species and habitats • Background noise (Simons et al. 2007) • Discrepancy between adjusted and unadjusted estimates might be substantial. Thus there could be profound implications for • Modeling species dynamics • Conservation design • Vital rates… • Available for game and endangered species • Remaining community members--fragmentary at best.
Patch Occupancy Models • Patch Occupancy offers an alternative approach. • Survey counts are re-tallied as “presence-absence” (detection-nondetection), • Assumptions and inferences are more tractable, • Preserves ability to estimate selected vital rates and community-level metrics over time.
Patch Occupancy Patch Occupancy (Psi) is defined as the probability that a site is occupied. It is conditioned by fact thatspecies is not always detected with certainty, even when present (p < 1) Notation: - probability site i is occupied - probability of detecting the species in site i at time j, given species is present • The model framework permits relating and p to site and/or sampling characteristics via the logistic model (or logit link). Most applicable to this project will be: • Site-specific: model and/or p • e.g., habitat type, patch size, patch isolation
Patch Occupancy and Conservation Design • It is possible to estimate abundance from presence-absence data (Royle and Nichols 2003). Two assumptions need to be met: • the probability of detecting an animal at a site is a function of how many animals are actually at that site, • the spatial distribution of the animals across the survey sites follows a specified prior distribution, such as the Poisson distribution, • BUT approach based on temporal replication, not spatial. • Abundance – revisited? • If review of literature or data suggests that discrepancy between adjusted and unadjusted counts is deemed acceptable • W. Thogmartin’s (2004) provides a comprehensive approach to estimate abundance from BBS data • Incorporates multiple factors influencing abundance estimates including possible changes in detection due to changes in observers over time.
Focal Regions SAMBI Eastern United States Assessments based on BBS and remotely-sensed data. Analytical Approach - Conservation Design Project - Approach SAMBI Region Patch Occupancy MacKenzie et al. 2003 and 2006 Monica Iglecia, MS Student Post-Doctoral Research Associate
Motivation Reduces extent and number of habitat classes within sampled unit Minimizes heterogeneity in detection probability Occupancy-habitat relationship “tighter” Improved interpretation Potential to increase sample size If deemed necessary, spatial correlation can be incorporated into models Primary Sampling Units BBS route segments/year Each BBS route split into 4 segments Secondary Sampling Units Each segments contains 8 stations (spatial replicates) Data Source and Sampling Units
Multi-Season Data Framework Local Extinction Colonization Year 1990 2001 2008 Surveys/ sampled rt/ year 1 2 ... k8 1 2 ... k8 1 2 ... k8 Closure
Multi-season Models Modeling dynamics or changes in occupancy over time(occupancy as a state variable) • Parameters of interest for this work: • t = t+1/ t = rate of change in occupancy • t = P(absence at time t+1 | presence at t) = patch extinction probability • t = P(presence at t+1 | absence at t) = patch colonization probability
Patch Dynamics – Multiple Seasons S1 S2 S3 (Not Ext.) (Occupied) (Ext.) (Col.) (Unoccupied) (Not Col.)
Multi-species, multi-season Occurrence Local Turnover Probability that a species selected at random from the community in year j was not present in year i Local Extinction or Colonization Probability that a species present in year i is not present in some later year j (i < j) The number of species not present at time i that colonize and are present at time j Rate of change in species richness Ratio of estimated richness in successive time periods Co-occurrence Model local rates of extinction and colonization as functions of occupancy of other species Community Dynamics
Essentials… • Formulate a priori hypotheses • Explicit statements about processes and predictions reflecting knowledge from the literature, expert opinion, and ecological theory • Useful to think in terms of the following question: • What is the ecological (landscape) basis for sensitivity of a species? • Life History • What biological process or requirement is (are) a determinant driver of the species’ continued survival?! • Habitat classes (states) need to be kept to a minimum and defined keeping in mind: • The scale at which it can be modeled and the interplay/relevance to biological processes
Patch Dynamics…and Conservation Design 2001 Landcover covariates 2006 Landcover covariates Landcover Change Analysis Initial set of a priori models Interval predictions and models 2000 2001 2002 2003 2004 2005 2006 2007 2008 E/C1 E/C2 E/C3 E/C4 E/C5 E/C6 E/C7 E/C8 Transition probabilities between patch occupancy and changes in habitat “states” Expressions of Persistence
Patch Occupancy and Conservation Design Modeling Species-Habitat Relationships Brown-headed Nuthatch • Evolved in the southeast • Mature, pine forests. • Local extinctions. • Notable culprits short-age rotations, fire suppression. • Poor disperser • Secondary Cavity Nester – snags
Brown-headed Nuthatch Structural and Functional Covariates • Colonization Process • Community – Presence of primary Cavity Nesters (+) • Inter-Patch Distance – Poor Disperser (-) • Inter-Patch Matrix – Distance*Composition • Extinction Process • Habitat – Mature Pine (-) • Fire Rotation – Increasingtime since last burn (-) • Community – Presence of Cavity Competitors (+)
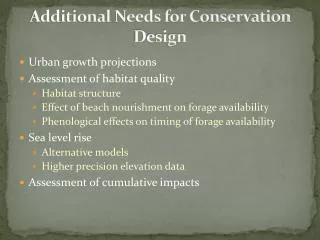
Patch Occupancy and Conservation Design • Predicting the possible impacts of urban growth and global climate are central themes of the project. • Projected impacts 5, 10, out to 100yrs • Global Climate – Range Dynamics • Temperature and landscape changes over past 30 yrs • Urban growth – Community Dynamics • Past sprawl on the SAMBI area and projected in 2 focal areas
Range Boundaries – transition zones - demographic flux With changing temperatures populations on boundaries are hypothesized to exhibit differing rates of extinction and colonization. Some predictions by regions are: Rate of local extinction: S>EW>N,C Rate of local colonization: N,C>EW>S Spatial Comparisons: Mean change in rate of local extinction: S>EW,C>N Assessment will rely on BBS data (1996-2008) and landcover assessments since the 1970s (landsat). Range Dynamics of North American Landbirds
Community Dynamics in Urban Landscapes • Evokesbiological integrity (Karr & Karr 1996) • We will frame hypotheses as per life history/functional traits (McGill et al. 2006, Croci et al. 2008). • Example from Croci et al. (2008) Urban Adapters Urban Avoiders • Forested, shrubs Open landscapes • Resident Migratory • Longer Life Expectancy Shorter • Enclosed nesters Open • Widely Distributed Narrower • > 2 clutches 1-2 clutches
Groupings by 4 life history traits…10 species Survival No. Broods Nest Structure Migratory Status
Community Dynamics in Urban Landscapes • Species Turnover – predictions over past 18 years based on life history…who comes in and leaves? • Species Richness – predictions about a “homogenized” avian community—any evidence? • Co-occurrence – predictions about functional groups, brood parasite-hosts • We will be looking for “thresholds” …patterns in the dynamic process of extinction and colonization under hypothesized prediction about
Summary of Expected Results Understand interplay between pattern and process in the SAMBI region, Understand range and community dynamics of avian species in Southern United States, Enable the development of decision-support tools for conservation design Incorporate transition probabilities between patch occupancy and habitat “states” given projected changes on landscapes Patch Occupancy and Conservation Design