Download

1 / 24
240 likes | 385 Views
PRODUCTIVE SANITATION SYSTEM PROJECT. Presented By: Fred Semyalo e-mail: fred@uweso.org Food security and Nutrition Programme Manager, Uganda Women’s Efforts to Save Orphans ( Uweso ). Study site characteristics.

E N D
PRODUCTIVE SANITATION SYSTEM PROJECT Presented By: Fred Semyalo e-mail: fred@uweso.org Food security and Nutrition Programme Manager, Uganda Women’s Efforts to Save Orphans (Uweso).
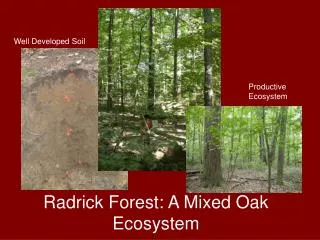
Study site characteristics • The study was conducted at Migyera Uweso Training Institute (MUTI), in Nakasongola district, central Uganda. • This area lies in the Pastoral rangelands otherwise known as the ‘cattle corridor’ and is characterised by low rainfall (915 to 1021 mm) with two rainy seasons, March to May and Sept to Dec • Temperature ranges from 12.5 – 30C. Altitude ranges from 129 – 1,524 m and soils which are moderate to poor. • The area is dominated by mainly smallholders with a lot of communal grazing, agro pastoral practices, low literacy level, (Republic of Uganda, 2004).
Vegetable field establishment • Nursery beds were established for 6 vegetable types during May 2009. • The seedlings were transplanted onto experimental plots of 4m x 2m (Table 1). • Because it was off-season at the time of transplanting, watering was necessary to support vegetable growth and minimise the effects of the dry spell on vegetables during the growing period.
Urine Application • Three weeks after transplanting, the vegetables were subjected to addition of urine-water mixtures in the ratios of 0:10, 1:9, 2:8 and 3:7 representing 0, 10, 20 and 30% urine, respectively. • Each urine-water mixture was applied either once every week or once every 2 weeks, giving a factorial arrangement of urine concentration and application frequency.
Urine Application Cont • Treatments were repeated four times (replicates) for each crop, giving a total of 192 plots. • The experimental design was a randomised complete block, with urine concentration and application frequency as the treatments. • At time of application, each plot received 20 litres of the diluted mixture.
Urine Application Cont • The plots were watered three times a week to meet the crop water requirements. • The urine-water mixtures were applied for 10 weeks • . Figure 2 shows a sample of the field appearance of the experimental plots at 2 weeks after transplanting.
Data collection • Soil and urine samples were collected at the start of the experiment, for laboratory analysis of the chemical (pH, N, P, K) and biological (pathogen) composition. • The vegetables were harvested piece-meal between 3rd July and 28th September 2009. • Field data collected and recorded included. This included; number of leaves or fruits and weight per harvest per plot.
Data analysis • The data were statistically analysed using Genstat package version 3.2. • Significant differences between treatment means were determined at a 95% Confidence level and means separated using the standard error of difference (sed) procedure
RESULTS AND DISCUSSION • Characteristics of the soil, urine and water used in the study - The soil was sandy clay loam texture, slightly acid with moderate organic matter and deficient in nitrogen - Fresh urine had a pH of 8.6 and this was higher for 1 month old urine (9.5). -The water used to dilute urine was from two sources: (stream water- PH 7.8, borehole water- PH 6.4 ). Both Sources had traces of N,P and K
Summary of the findings • Application of 10% urine weekly significantly increased total cabbage yield from 3.98 kg to 12.89 per plot of 8 m2 [or 4,975 kg ha-1 to 16,113 kg ha-1] . Expected income from cabbage also increased from Ug. Shs. 3,975/= to 12,892/= per 8 m2 plot [or Ug. Shs. 4,968,750/= to 16,115,000/= per ha]. • Weekly urine application at concentrations higher than 10% decreased cabbage yield (although not significantly). • Applying urine once every two weeks did not significantly affect cabbage yields.
Summary of the findings cont • Averaged over the two frequencies (weekly & every 2 weeks) urine application up to 20% had no significant effect on average leaf/fruit weight for all vegetables (spinach, kale, cabbage, eggplants, tomato). Increasing urine concentration to 30% decreased average cabbage head weight by 36% below the control. • Average cabbage head weight was significantly bigger on plots receiving urine weekly than where urine was applied once every 2 weeks (548 vs 427 g per head,).
Effect of urine application on tissue nutrient composition of vegetables Spinach
Effect of urine application on spinach leaf nutrient composition Eggplant fruits
Effect of urine application on the nutrient composition of cabbage
Summary of the findings • Optimum spinach leaf N content was attained at 10% urine applied weekly or 20% urine applied once every 2 weeks. However, at optimum spinach leaf weight (23g) the leaf N content was higher for weekly applied urine than once applied once in 2 weeks (3.3% vs 3.0), giving the former as a better quality food material than the latter.
Conclusions • Human urine contains nitrogen in a readily available solution form. • The benefits of nitrogen in urine (e.g. increased cabbage yields and head size) are better observed where the urine is applied more frequently (e.g. weekly) rather than once in 2 weeks.
Way forward • Involve the wider community in PSS project • Conduct a vigorous campaign regarding the use of human waste in crop production • Ensure that all proposals have the aspect of PSS. THANK YOU MWEBALE NYO