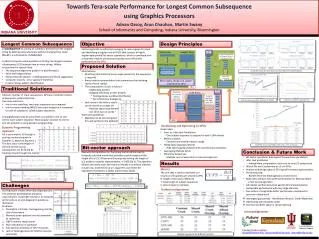
Challenges . . .
Challenges. Managing Labour Deficit / Surplus Pace of Construction Investment Retirement Rates Worker Availability Performance of Other Sectors Regional Realities National Standards Government Policies World Events Productivity etc. Challenges.


Challenges . . .
E N D
Presentation Transcript
Challenges . . . • Managing Labour Deficit / Surplus • Pace of Construction Investment • Retirement Rates • Worker Availability • Performance of Other Sectors • Regional Realities • National Standards • Government Policies • World Events • Productivity • etc . . . . .
Challenges . . . Source: Registered Apprenticeship Information System • According to the Canadian Apprenticeship Forum less than 20% of employers provide apprenticeship training
Challenges . . . • Construction educators and trainers include: • Industry (80% of apprenticeship on-the-job) • Joint Training Trust Funds • Community Colleges and Universities • Construction Associations (Local or Regional) • Trade Contractor Associations • Provincial Construction Safety Associations • Labour Groups • Private Trainers • Owners (User of Construction Services) • Suppliers • In most cases, they work in isolation
Why LMI is Important . . . • Anticipate the demand for Construction Services • Where are the “hot spots” • Getting better demand information • Translating demand into worker requirements • Paint a “Realistic” Picture of Labour Supply • Demographics by trade and by province / region • Define the supply of labour by province / region • Understand the movement of labour • Target Supply Side Solutions • Replenishes supply of labour in an effective manner • Youth, Aboriginals, Women, Immigrant Workers
Why LMI is Important . . . • Early warning system • Labour supply demand forecasting tool • Proactive vs reactive • Time to implement short, medium, long term solutions • Decision making tool • Alternative scenarios, impact analysis • Venue for industry discussion • Create common understanding of labour market • Collaborative solutions • Issues cannot be resolved by one group • Takes effort of all stakeholders
Why LMI is Important . . . • With local / regional participation, established LMI Program to provide industry with better information on the demand for and supply of skilled labour: • LMI is the cornerstone of the CSC’s activity: • Identify training requirements • Anticipate and plan for tight labour markets • Increase apprenticeship enrollments and completions • Facilitate worker mobility • Identify sources of labour across the country • Influence labour market policy • Drives work of CSC
CSC LMI Program • Currently, the Construction Sector Council produces an annual construction labour requirements forecast: • 9 year time horizon • 32 trades / occupations • For each province: • Economic and investment outlook • Construction activity • Construction Employment requirements • Rank labour availability
CSC LMI Program • Example of requests for LMI data: • Syncrude, Shell, Suncor, CNRL • Carpenters Training Centre in New Brunswick • Alberta Government • Citizenship and Immigration • Algonquin College • 2010 Winter Olympics, B.C. Whistler • Manitoba Hydro • B.C. Hydro “Looking for workers in our backyard is not good enough anymore” “Workforce availability is the biggest risk factor in undertaking major projects”
LMI Forecasting Components of the program: • 32 trades and occupations • 15 regions in Canada (10 provinces and 5 Ontario regions) • Employment, labour force, excess supply • Construction and other industries • Statistics Canada Census data (LFS monitoring) • Labour Supply • Labour Demand, including • Expansion demand • Replacement demand
LMI Forecasting Key Elements of the Forecasting Tool: • Provincial/regionalapproach – matches the provincial/regional structure of the construction labour market. • Regional Network of LMI – committees comprised of key industry and government stakeholders tasked with bringing regional realities to the forecast. • Mid term and long term forecast – facilitates planning and the development of supply side solutions. • Macro economic outlook - the construction forecast is grounded in the context of a broader economic forecast. • Construction investment outlook –derived from provincial/regional major project information vetted by provincial/regional stakeholders (Coefficients: Employment Per $Million Real Expenditures). • Supply side tracking – builds on the data provided through traditional data sources bringing a greater degree of accuracy. • Labour requirement assessment – provides a quantitative and qualitative analysis of labour requirements for 32 trades/occupations.
LMI Forecasting • Process Steps: • Collect and analyze major project information • Conduct industry consultation • Set economic scenario assumptions • Create economic scenarios • Set trades assumptions • Produce trades scenarios • Conduct demand-supply balance assessment • Disseminate results
LMI Forecasting • Regional Network of Labour Market Information Committees • Provincial, regional, local • Comprised of labour, contractors, owners, governments, educators and trainers • Roles and responsibilities include: • reviewing / commenting on macroeconomic assumptions • establishing regional major projects lists for non-residential sectors • compiling, information on housing starts and renovation activity • reviewing and validating forecasts to ensure they reflect regional realities • assisting in defining the labour supply relationships (training, demographics, measuring replacement demand, labour mobility) • determining whether trades need further analysis • assisting in the preparation of the final report
LMI Forecasting CONSTRUCTION INDUSTRY OTHER INDUSTRIES Demand Supply Demand Supply Balance Balance Total Balance Trades Shortage Excess Trades
LMI Forecasting 16 Mobility Across Adjacent Labour Markets 14 12 10 Unemployment Rate 8 6 4 2 0 Region A Region B Region C Region D Region E Market Market with unemployment below the natural rate will attract workers from other markets
LMI Forecasting • Labour Market Rankings • Scale of 1 (excess supply) through 5 (excess demand) summarizes the market conditions • Regional Rankings are a weighted average of four measures • Estimated unemployment rate relative to natural unemployment rate • Employment Growth • Replacement demand as a % of the Labour Force • Industry Survey • The potential for mobility signals possible changes in provincial / regional rankings
LMI Forecasting Market Conditions Ranking by Trade 1 (excess supply) to 5 (excess demand)
LMI Forecasting • Requests for more details are a priority for the CSC • Trade / occupational breakdowns, in some cases, do not meet industry needs • Industry participants requested that more detail be developed around labour supply and demand
LMI Forecasting • Workforce Forecasting Tools available to the construction industry: • Construction Owners Association of Alberta • Best Practices Annual Workforce Supply / Demand Forecast • Commission de la Construction du Québec • Annual Construction Workforce Forecasting Model by Region • Resource from the Construction Sector Council • Construction Looking Forward – Labour Requirements for Canada and the Provinces 2007-2015