Download
1 / 47
470 likes | 563 Views
AGEC 340 -- International Economic Development Course slides for week 4 (Feb. 2 & 4) Population growth and demographic transition*. What determines changes and differences in population growth, and in the proportion of people at each age?.

E N D
AGEC 340 -- International Economic DevelopmentCourse slides for week 4 (Feb. 2 & 4) Population growth and demographic transition* • What determines changes and differences in population growth, and in the proportion of people at each age? * If you’re following the textbook, this material is in Chapter 4.
The English language can be very confusing! • When talking about… • “demography”: study of population, also the population itself • “population growth”: increasing number of people • “demographics”: measured characteristics of the population “ • But also… • the “economy”: the prod. & cons. activities of a population • “economic growth”: increases in prod. & cons. per person • “economics”: a way of studying the economy Some terminology: Demography and economics
Is population growth a problem……or an opportunity? • Pop. growth lowers the amount of available land and other kinds of capital per person, • …but it raises the total size of the economy, which may offer some benefits of scale: • more opportunity to specialize & trade • more innovators with new ideas • a larger market to cover fixed costs • on balance, pop. size itself is not really bad; but changes during transition can be awful!
Slow fall Fast rise Famine in China, 1958-1961: with quick catch-up afterwards! meanwhile, in the richer countries
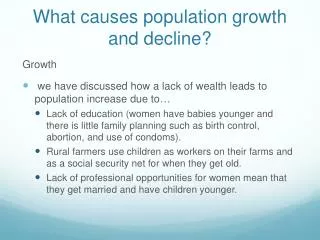
What drives population growth? • The “demographic transition”: • population growth rates rise and then fall …but what happens during the transition? • What initiates the change? • Do all countries follow the same path? • What determines the speed of change?
What happens during demographic transition? Our textbook picture is:
So what drives population growth is: • The “demographic transition”: • population growth rates rise and then fall • driven by a decline in the death rate • the “mortality transition” • followed by a decline in the birth rate • the “fertility transition” • Do all countries follow the same path?
Here’s the demographic transition for one specific country: what type of country is this? what caused these changes? Crude Birth Rate (CBR): births per thousand people Crude Death Rate (CDR): deaths per thousand people Source: Montgomery, Keith (2000), “Notes on the Demographic Transition.” Available online at www.uwmc.uwc.edu/geography/Demotrans/demtran.htm.
Each year’s “natural increase” in a populationis their total births minus total deaths How fast is population growth? Crude Birth Rate (CBR): births per thousand people Crude Death Rate (CDR): deaths per thousand people Source: Montgomery, Keith (2000), “Notes on the Demographic Transition.” Available online at www.uwmc.uwc.edu/geography/Demotrans/demtran.htm.
That was Sweden… • Death rates began to fall after 1800 • fell gradually from 25-30 per thousand • stopped falling at 10 per thousand in 1955 • Birth rates began to fall after 1825 • fell gradually from 30-35 per thousand • reached death rate of 10 per thousand in 1980 • Pop. growth went from 0.5 to 1.0 to zero pct./yr
And here it is again, in comparison with another country: what type of country is this one? The first country is Sweden… the second is Mauritius, an island off the coast of Africa Source: Montgomery, Keith (2000), “Notes on the Demographic Transition.” Available online at www.uwmc.uwc.edu/geography/Demotrans/demtran.htm.
Population growth rates depend on both birth and death rates How fast was Mauritius’s peak rate of population growth? When was it? Mauritius had very fast population growth after WWII, because of a very rapid decline in its death rate Source: Montgomery, Keith (2000), “Notes on the Demographic Transition.” Available online at www.uwmc.uwc.edu/geography/Demotrans/demtran.htm.
Fast mortality decline after WWII was driven by public health breakthroughs in many tropical countries Reprinted from D.E. Bloom and J.G. Williamson, 1998. “Demographic Transitions and Economic Miracles in Emerging Asia.” World Bank Economic Review 12(3): 419-55.
…but now let’s compare Swedento a different country: ??--Birth Rate Sweden--Birth Rate Sweden--Death Rate ??--Death Rate Sources: Population Reference Bureau (www.prb.org). Underlying data are in 5-year intervals, from B.R. Mitchell, European Historical Statistics 1750-1970 (1976): table B6; Council of Europe, Recent Demographic Developments in Europe 2001 (2001): tables T3.1 and T4.1; CELADE, Boletindemografico 69 (2002): tables 4 and 7; F. Alba-Hernandez, La poblacion de Mexico (1976): 14; and UN Population Division, World Population Prospects: The 2002 Revision (2003): 326.
Remember, population growth rates depend on both birth and death rates How did this country’s birth rate stay high for so long? How did that affect their population growth? ??--Birth Rate Sweden--Birth Rate Sweden--Death Rate ??--Death Rate Sources: Population Reference Bureau (www.prb.org). Underlying data are in 5-year intervals, from B.R. Mitchell, European Historical Statistics 1750-1970 (1976): table B6; Council of Europe, Recent Demographic Developments in Europe 2001 (2001): tables T3.1 and T4.1; CELADE, Boletindemografico 69 (2002): tables 4 and 7; F. Alba-Hernandez, La poblacion de Mexico (1976): 14; and UN Population Division, World Population Prospects: The 2002 Revision (2003): 326.
Africa’s demographic transition started late, and had a very high peak population growth rate Source: Calculated from data in FAOStat (2007).
So what explains the historical mortality decline in today’s rich countries? what kinds of disease are these? when were they reduced? The first measles vaccine was introduced in 1968, way after the disease stopped causing many deaths Source: Montgomery, Keith (2000), “Notes on the Demographic Transition.” Available online at www.uwmc.uwc.edu/geography/Demotrans/demtran.htm.
An example of mortality decline in the US Source: Montgomery, Keith (2000), “Notes on the Demographic Transition.” Available online at www.uwmc.uwc.edu/geography/Demotrans/demtran.htm.
The 1918 flu epidemic was unusual in many ways:normally, mortality changed most for children
Another view of mortality by age Source: Montgomery, Keith (2000), “Notes on the Demographic Transition.” Available online at www.uwmc.uwc.edu/geography/Demotrans/demtran.htm.
The HIV/AIDS epidemic is unusual in many ways: one complication is that it affects mainly adults Great Britain Botswana Niger 17th C. England Source: Montgomery, Keith (2000), “Notes on the Demographic Transition.” Available online at www.uwmc.uwc.edu/geography/Demotrans/demtran.htm.
The demographic transition involves both mortality and fertility • Mortality rates fall due to better nutrition, public health conditions, medicines… • What happens to fertility rates? • How high are the highest fertility rates? • biological maximum is around 12 • economic maximum is around 8-10 • How low are the lowest fertility rates? • biological minimum is zero • replacement fertility is around 2
Birth rates depend on both fertility (births/woman) and the number of women Source: United Nations, World Population Prospects: The 2004 Revision (medium scenario), 2005 Reprinted from Population Reference Bureau, 2007 World Population Datasheet. (www.prb.org)
Fertility rates don’t always fall! Average number of children per woman Fertility Trends in Selected Developing Countries, 1950-2005 Uganda Kenya Colombia South Korea Source: United Nations, World Population Prospects: The 2004 Revision, 2005. Reprinted from Population Reference Bureau (www.prb.org), 2007.
…and they vary in rich countries too! Fertility Trends in Europe and the United States: 1980-2006 Source: National statistical agencies.. Reprinted from Population Reference Bureau, 2007 World Population Datasheet. (www.prb.org)
The fertility transition is usuallyfrom 6-8 to 1-3 births per woman • What can explain this regularity? • Why do the poor have more kids than the rich? • why might they choose higher fertility on purpose? • poorer women may have fewer other options • their children may be more valuable to them • poorer children start work at a younger age • …and may help parents in old age or sickness • where child mortality is high, parents need to have many children to have some survive • availability and ease of contraception matters too!
One explaination for fertility declineis lower infant mortality Source: Montgomery, Keith (2000), “Notes on the Demographic Transition.” Available online at www.uwmc.uwc.edu/geography/Demotrans/demtran.htm.
Fertility decline versus infant mortalityacross countries Source: Montgomery, Keith (2000), “Notes on the Demographic Transition.” Available online at www.uwmc.uwc.edu/geography/Demotrans/demtran.htm.
Fertility decline vs. infant mortality over time Source: Montgomery, Keith (2000), “Notes on the Demographic Transition.” Available online at www.uwmc.uwc.edu/geography/Demotrans/demtran.htm.
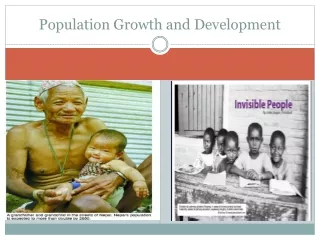
The demographic transition affects more than population growth • How does transition affect the mix of people? • Death rates fall mainly for children • Fertility rates fall later and more slowly • so the burst of population growth takes the form of more surviving children
Demographic transition and age structure:your textbook “population pyramid”
Demographic transition and age structure:the population pyramid for Nigeria1980 Reprinted from www.census.gov/ipc/www/idb.
Demographic transition and age structure:the population pyramid for Nigeria2000 Reprinted from www.census.gov/ipc/www/idb.
Demographic transition and age structure:the population pyramid for Nigeria2020 Reprinted from www.census.gov/ipc/www/idb. This helps explain your results from Exercise 1!
Demographic transition and age structure:population pyramids for Indonesia1980 Reprinted from www.census.gov/ipc/www/idb. Indonesia has a much more “mature” population pyramid than Nigeria
Demographic transition and age structure:population pyramids for Indonesia2000 Reprinted from www.census.gov/ipc/www/idb. Indonesia has a much more “mature” population pyramid than Nigeria
Demographic transition and age structure:population pyramids for Indonesia2020 Reprinted from www.census.gov/ipc/www/idb. Indonesia has a much more “mature” population pyramid than Nigeria
Demographic transition and age structure:population pyramids for the United States1980 Reprinted from www.census.gov/ipc/www/idb. The population “ages”, but there are continued echoes of the post-WWII baby boom
Demographic transition and age structure:population pyramids for the United States2000 Reprinted from www.census.gov/ipc/www/idb. The population “ages”, but there are continued echoes of the post-WWII baby boom
Demographic transition and age structure:population pyramids for the United States2020 Reprinted from www.census.gov/ipc/www/idb. The population “ages”, but there are continued echoes of the post-WWII baby boom
Demographic transition and the age structure of the population • During the demographic transition, when death rates fall before and faster than birth rates, • at first kids are an increasing share of the population, so the “dependency ratio” rises • then kids are a decreasing proportion of people, and the share who are working rises • eventually share who are elderly rises, and the proportion who are working falls again
Changing age structure has a big influence on the economy 100 90 80 70 60 No. of children (0-14) per 100 adults (15-59) 50 40 30 20 10 0 1950 1960 1970 1980 1990 2000 2010 2020 2030 2040 2050 E. Asia S. Asia Sub-Sah. Africa Whole World Past and Projected Child Dependency Source: UN Population Division, World Population Prospects: The 2000 Revision (http://esa.un.org/unpp)
In conclusion... • The demographic transition to higher and then lower population growth rates… • starts with a decline in child mortality • due historically to better nutrition and living conditions, and then to medical intervention • is completed by a decline in fertility • due mainly to increased child survival, increased investment in child’s education, reduced need for child’s work, and increases in mother’s other opportunities
…demography is very important! • in Europe death rates fell slowly, in response to slow improvements in standard of living; • in Africa, Asia and Latin America, death rates fell quickly with sudden availability of vaccines, antibiotics and disease control after WWII • so today’s poor countries have had much faster pop. growth and worse dependency ratios than Europe or America ever did