Download
1 / 21
210 likes | 311 Views
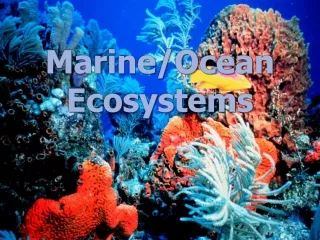
Explore the impact of climate warming on ocean ecosystems' primary production through various models and the influence of temperature on biomass, light, and physiology. Discover the interplay of light, nutrient availability, and growth rates in ocean and terrestrial systems.

E N D
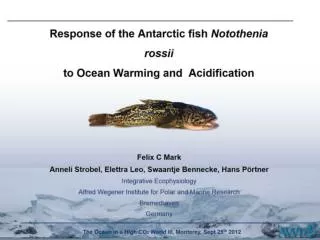
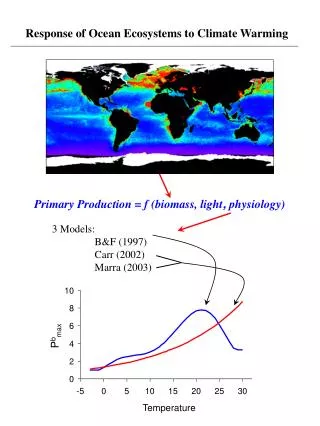
Response of Ocean Ecosystems to Climate Warming Primary Production = f (biomass, light, physiology) 3 Models: B&F (1997) Carr (2002) Marra (2003) Pbmax Temperature
constant Pbopt measured Pbopt Modeled IPP (mgC m-2 h-1) r2 = 0.38 r2 = 0.86 Measured Integral Primary Production (mgC m-2 h-1) Product Yields
Ocean? Temperature?? Terrestrial Systems: The CASA model
net carbon fixing capacity light harvesting capacity Pbmax = Temperature Enzyme Activity & Concentration No direct effect on Pbmax Growth Rate Equal changes in carbon fixation & light harvesting No direct effect on Pbmax?
Relative Chlorophyll Concentration Growth Irradiance (mol quanta / m2 / s) Ek-dependent variability Nutrient ‘Charged’ Nutrient ‘Depleted’ < MLD Chlorophyll ( ) Calvin Cycle Capacity ( ) & Pbmax ( ) : > MLD Growth Irradiance (umol quanta m-2 s-1)
Photoacclimation Relative Subsurface Light 30 Ein 300 Ein Relative Chlorophyll equal concentration Optical Mixing Depth Photoacclimation – average or median? Average Mixed Layer Light Median Mixed Layer Light
0 0 -50 -50 -100 -100 -150 -150 -200 -200 -50 -40 -30 -20 -10 0 10 20 30 40 50 -50 -40 -30 -20 -10 0 10 20 30 40 50 Atlantic Meridional Transect Measured & Modeled Mixed Layer Pbmax Chlorophyll-a Concentration (mg/m3) .01 .02 .05 .1 .2 .5 1 5 10 50 Latitude AMT-3 AMT-2 Nutricline & Thermocline Depth (m) North South North South Latitude Latitude
BATS 6-year Time Series Measured & Modeled Pbmax Progressive Days
Model light-saturated photosynthesis Measured light-saturated photosynthesis -- requires MLD --
Ek-independent variability Chlorophyll-specific photosynthesis Light Field Data
1 2 1 2 O2 O2 H20 H20 Fdx Cyt b6 f PTOX c553 2 H 2 H H 2 H aa3-type Cyt. Oxid. NAD+ GAP RuBP Ndh ATPase PQ PSII PSI e e e e PQH2 e e e e e e e e e e 1 2 1 2 NADH NADH NADH NADH O2 ATP Stroma ADP + Pi ATP Cell Metabolism NADPH H20 H202 O2 + H20 A Lumen Chloroplast PGA PGA BPGA BPGA NADPH NADP+ GAP/DHAP GAP/DHAP OAA OAA NO3- CO2 Malate Malate OAA Malate NO2- Rubisco Calvin- Bensen Cycle NH4+ OAA Malate GS Storage gln glu NAD+ GOGAT citrate GAP Citric Acid Cycle OAA NAD+ Amino Acid Biosynthesis PEP E T C ADP + Pi GAP Cytosol B H20 Mitochondria
Photosystem II O2 Sum = Remote Sensing Chlorophyll Photosystem I Nitrogen Reduction & Amino Acid Biosynthesis Fast Pathway to Mitochondria to generate ATP Carbon Fixation Calvin Cycle Medium Pathway 3-C product to Citric Acid Cycle & Mitochondria Carbon Storage Carbon Growth
In a single species, light & nutrients can cause C:Chl to vary from < 10 to > 800 Light Growth Rate (+nutrients) (+light) Chlorophyll : Carbon Growth Irradiance Relative Growth Rate Note: Chl:C ranges from < 0.001 to > 0.1
Pbmax Light versus Nutrient as dominant control Light limitation dominates Light-Nutrient interactions Temperature BOTTOM LINE: Temperature not a good model for current production & worse for future. Best approach is direct attack on light and growth rate
J. Bishop 1999 Deep Sea Research cp cp* POC 14C-based photosynthetic efficiency HOT BATS NABE
90o 90o 75o 75o 60o 60o E 45o 45o NP NA 30o 30o NA NP 15o 15o C NI F CP CA 0o 0o CA 15o 15o SI SA B SP 30o 30o D SP SA 45o 45o 60o 60o 75o 75o 90o 90o B C Satellite Chl:C Ratio ( ) Chlorophyll concentration ( ), bbp ( ) D E F Year
Light Interaction Growth rate bbp-based Chl:C = a + b exp -3 Ig
10 1 SeaWiFS chlorophyll 0.1 0.01 0.001 0.001 0.01 0.1 1 10 Inversion chlorophyll Current Limitation… Inversion bbp 0.05 0.01 0.001 0.0005 0.01 0.1 1 10
PhyLM The Physiology Lidar- Multispectral Mission Exploring complex ecosystems of our global oceans