Download
1 / 7
70 likes | 189 Views
Flowchart and Spreadsheet Views. Model window split into two views Flowchart view Spreadsheet view Many model parameters can be edited in either view Horizontal splitter bar to apportion the two views

E N D
Flowchart and Spreadsheet Views • Model window split into two views • Flowchart view • Spreadsheet view • Many model parameters can be edited in either view • Horizontal splitter bar to apportion the two views • Project Bar Usually down the left edge of Arena window. Hosts panels with modeling building blocks: modules • Status Bar at very bottom of Arena window. Displays various information sensitive to status Chapter 3 – A Guided Tour Through Arena
Moving Around, Up, Downin Flowchart View of Model Window • Underlying world space for model • (x, y) coordinates in arbitrary units (> 32K in each direction) • Pan with scroll bars, arrow keys • Zoom in (down): or + key • Zoom out (up): or – key • See all at min altitude: or * key • Named views • Save a pan/zoom view for different parts of model • Assign a Hot key (case-sensitive) • Access via View/Named Views … or ? key • Display grid ( ), snap to grid ( ) toggles Chapter 3 – A Guided Tour Through Arena
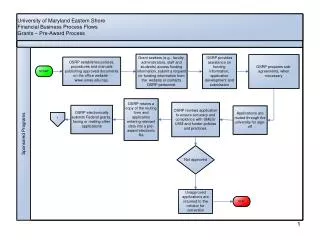
Relations Among Modules • Flowchart and data modules are related via names for objects • All names you make up in a model must be unique across the model, even across different types of modules Chapter 3 – A Guided Tour Through Arena
Connecting Flowchart Modules • Establishes the (fixed) sequence of flowchart modules through which entities will flow • To make a connection • Click Connect button (or Object/Connect) • Cursor changes to cross hairs • Click on exit point from source module, then entry point on destination module • Make intermediate clicks for non-straight line in segments • Object menu toggles • Auto-Connect – automatically connect entry point of newly placed module from exit point of selected module • Smart Connect – force segments to horizontal/vertical • Animate Connectors – show entities moving along connectors (zero time for statistics collection) Chapter 3 – A Guided Tour Through Arena
Dynamic Plots • Trace variables, queues as simulation runs • Disappear after run ends (to keep, must save data, postprocess via Output Analyzer — later) • A kind of “data animation” • Plot button from Animate toolbar… “Add” for • Expression to plot (help via Expression Builder … later) • Min/Max y-axis values (initially guesses, maybe revise) • Number of “corners” to show (# History Points) at a time • Stepped option (for piecewise-constant curves) • Colors • In Plot dialog – Time Range (x axis), cosmetics • Resize plot itself by dragging corners Chapter 3 – A Guided Tour Through Arena
Types of Statistics Reported • Many output statistics are one of three types: • Tally – avg., max, min of a discrete list of numbers • Used for discrete-time output processes like waiting times in queue, total times in system • Time-persistent – time-average, max, min of a plot of something where the x-axis is continuous time • Used for continuous-time output processes like queue lengths, WIP, server-busy functions (for utilizations) • Counter – accumulated sums of something, usually just nose counts of how many times something happened • Often used to count entities passing through a point in the model Chapter 3 – A Guided Tour Through Arena