Download
1 / 37
370 likes | 506 Views
An Overview of Data Analysis for Evaluation Assistant Research Projects. Adapted from the Association for Institutional Research Customized for the STARS Alliance Evaluation Assistants by Audrey Rorrer, UNC Charlotte. Outline. Key Considerations in Data Analysis Components of Data Analysis

E N D
An Overview of Data Analysis for Evaluation Assistant Research Projects Adapted from the Association for Institutional Research Customized for the STARS Alliance Evaluation Assistants by Audrey Rorrer, UNC Charlotte
Outline • Key Considerations in Data Analysis • Components of Data Analysis • Distinguishing Data Types • Distinguishing Different Types of Analyses • Overview of Different Statistical Software • EA Project Example: • Terrell Perrotti, South Carolina State University
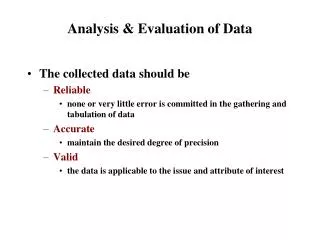
Key Considerations in Data Analysis • Identify the purpose of the analysis or project • Understand the sample(s), i.e. the people, under study • Understand the instruments being used to collect data • Be cognizant of data layouts and formats • Establish a unique identifier if matching or merging is necessary (e.g. for pre to post comparisons)
Components of Data Analysis • Statement of research question(s) • Methods used to answer research question(s) • Timeline • Budget (usually, but not necessarily for EA projects) • Data management procedures (paper surveys, excel, etc. as applicable) • Design for measuring, collecting, scoring, equating, etc. • Data cleaning procedures (e.g. removing outliers) • Quality control procedures at every step in the project Good news: you’ve already addressed these components in your EA Project Timelines!
Some Examples of Analyses • Frequency Distributions and Cross –Tabulations • How many people responded with a correct answer to item 1 • How many of those responding correctly were male and female • Descriptive Statistics (Means, Std. Deviations, Correlations) • What was the average satisfaction rating • What was the standard deviation from the mean score on a particular item • Did an item correlate (or relate to) another item or outcome • T-tests and Analysis of Variance (ANOVA) • Is there a difference between pre and post test outcomes • Is there a difference between pre and post test among different groups, such as males and females • Regression • Does a variable (or factor) predict a certain outcome • If so, what is the regression equation that models the outcome
And finally, the More Advanced the Analysis, the Greater the Amount of Preparation • Most analyses can be executed straight from a working data file • Excel • SPSS (statistical package for social sciences) • Some analyses may require transformations of the raw data, subsets, or specific input data to comply with statistical software • Example: you will need to use a numerical code to represent nominal data when analyzing in excel or SPSS • such as male=1 and female=2 • such as pre-test=1 and post-test=2
Useful Terms for Data Analysis • A variable is a characteristic or condition that changes or has different values for different individuals • Variables may require special coding for different data representation • Nominal (ethnicity, gender, name of school) • Ordinal (pre test and post test codes) • Scale (a rating scale with incremental values) • Ratio (incremental scale with an absolute zero point, such as temperature or money) • Treatment or intervention- the medicine or experience that is provided to the participants(e.g. a weight loss plan; a robotics outreach program) • Dependent variables are the ones observed in order to assess effect of treatment or intervention (e.g. amount of pounds lost; attitudes about computing) • Independent variables are those manipulated by the researcher • For experimental research- the treatment group vs non-treatment group; e.g. a Jenny Craig Group vs Weight Watchers Group vs No Weight Loss Plan Group • For quasi-experimental research (most SLC research projects)- it may be the variables that cannot be controlled, such as gender, age, ethnicity, but it depends upon how the study is set up
Overview of Programs Used for Data Analysis • SAS and SPSS are most commonly used and tend to focus on the “classic” statistical routines: • Descriptive statistics and non-parametric (“distribution-free”) tests • ANOVA / Regression • Factor analysis • However, many psychometric procedures (e.g. IRT) and newer statistical models are not as well supported by these programs • Very specialized programs are used • Designed to do a specific task or validate a theory • Specialized programs may have issues • Interface not very user-friendly • Additional data types or files required • Expense • Most EA Projects will use Excel and/or SPSS, so we’ll focus on these
What is SPSS? • A commercially produced statistical software package that is widely used in the fields of Education and Psychology • Program functionality is broken into over a dozen different modules which are sold individually • Most commonly used are Base, Regression Models, and Advanced Models • Other modules can be installed to run more complex analyses • SPSS data files include both the data and also variable information (variable and value labels, formats and missing values)
What Program Should I Use? • Microsoft Excel is the most basic and accessible spreadsheet program available today • It is most ideal for general data exploration, histograms, scatter plots, etc. • Appearance of tables can be customized • Allows for easy transition to other programs to complete analyses and write reports • However, its heritage is not as a statistical analysis program • SPSS is designed for specific analytic tasks such as statistical significance of findings • Balance the results and what will being presented • Choose wisely in the interests of efficiency and accuracy of results • Some output is good for looking at the data through basic exploration and to generate basic tables, but not to present the data
Terrell’s Project • South Carolina State’s SLC students are conducting a 7 week robotics club to teach middle school students how to manipulate robots. The goal is to increase their knowledge & interest in computing. The hypothesis is that the students’ interest in computing will increase over the course of the 7 week intervention • Computing attitudes are being measured by the Computing Attitudes Survey, available on the EA Website and widely used throughout STARS
Some Nerdy Information for those of you who may be interested • The study design is quasi-experimental , pre/post survey design • no control group (e.g. a comparable middle school class without the robotics intervention who take the pre and post survey at the same time as the students in the class with the robotics intervention)
Data Analyses: Option A For the primary research question: Do students’ attitudes towards computing improve after participating in a 7 week robotics program improve? • Descriptive Information • Statistical Significance • T test in SPSS will determine • If there were increases in student attitudes from pre to post • If those increases (or decreases) were statistically significant (i.e. didn’t happen by chance alone)
Step 1: Collect and Manage Data • Terrell gave the Computing Attitudes Survey to the middle school class at the first day the SLC students visited the class • Protect Anonymity of the Students: • He did NOT collect student names, but instead gave each survey sheet a code to indicate that it was a pre-survey • Use something that makes sense for the project and be consistent for the post test, making sure to distinguish between the pre and post tests • In this example, the pre-surveys are all coded (or labeled) as 1, and the post surveys are labeled 2
A note about coding surveys • If there is only 1 classroom being surveyed, a simple method is feasible • If there are several classrooms, i.e. Mr. Jones and Mrs. Smith, then a more complex coding system is needed • Why? Because the teacher/classroom becomes a variable • If Terrell wanted to do a matched comparison of student outcomes, say compare Juan’s pre survey to Juan’s post survey, a unique code will need to be devised for each student • Protect their identities, and allow match comparisons
A sample of the student survey STARS Outreach Computer Attitude Survey for Secondary Students Please read each sentence and circle your answers to each one as follows: SD = Strongly Disagree; Disagree; Neutral; Agree; SA=Strongly Agree • Please check beside the ways you use computers: • ___Computer games __homework ___Facebook ___email • How old are you?__________ • I am: __White __Black __Native American __Asian __Hispanic • __Other:____________ (check one) • I am a: male / female (circle one)
Step 2: Setting up the Excel File • Terrell creates an excel spreadsheet for all the surveys • Each row is a student response • Each column is an item on the survey • An additional column indicates whether or not the survey was a pre or post collection • For good research practice, he has one tab with the actual responses and a second tab with the numerical representations
He decides to use item 20 descriptively * He could use item 20 quantitatively to see if there are relationships between attitudes about computers and how students use computers- but this is beyond the scope of this presentation
Step 3: Conducting a T test in SPSS • SPSS is the best way to conduct a T test • Your school most likely has a student version that you can use free, or check with your faculty advisor • Step 1: upload the coded excel data into an SPSS file • Copy and Paste the excel data into the data view tab • It will look pretty much the same • You’ll want to add the code descriptions in the variable tab
Getting Descriptive Data • Basic Descriptive Statistics • Means and Standard Deviations for Total Group and by Gender • Step 1: Go to Analyze tab, then click Descriptives, then Frequencies • Click on Age and then the arrow tab to move it into the window, repeat with Race and Gender • Choose the statistics you want and OK • You’ll get a print out of number, percentage and anything else you selected (mean, median, mode)
Running the T test • A T test will answer the question: is there a difference between pre and post surveys? And will tell you if any differences are significant • That is, they didn’t occur by chance • This is the really abbreviated explanation; you should read more about it online • STEPS: Analyze; Compare Means; Independent Samples • Then select the Grouping Variable (which is Time) and enter 1, 2 in the “define group” boxes • Then select and move over items 1-19 into the Test Variable box • Click OK and the T test will run
Sample Output • Look at the average (mean) scores at pre and then at post to see if there was an increase or decrease • Then look at the Independent Samples Test table in the “.Sig” column • If the number in this column is below .05, the difference between pre and post is statistically significant • The following example is from an actual survey conducted with college students to measure self-efficacy, attitudes toward computing, help-seeking and intention to go to graduate school
Sample of Reporting Outcomes *significant increase at p<.05
Other Options • Terrell could decide that he wants to know if there are any differenced in outcomes based upon gender or race • A Cross-Tabs for these variables can be conducted in SPSS, along with a chi-square analysis • Or an analysis of variance (ANOVA) • This analysis would also apply if there were different classes being compared, as in Mr. Jones and Mrs. Smith’s classes • Descriptive information is reported in aggregate • Total number of students (15) • Gender number and percent • Race/ethnicity numbers and percent
Storing Data • This is particularly important if names are associated with data. In our case it’s not. • But keep in mind: always safeguard participant identity! • Limit access to data sources • Password protect files • Keep data separate from the actual surveys with identifiers
More Information • This was a very basic overview. • For more information on data analyses: • Chi square: http://math.hws.edu/javamath/ryan/ChiSquare.html • ANOVA: http://www.statisticssolutions.com/resources/directory-of-statistical-analyses/anova • For more information on SPSS: • http://www.hmdc.harvard.edu/projects/SPSS_Tutorial/spsstut.shtml • Contact Audrey directly if you would like to address specific questions about your EA project!