Download
1 / 51
520 likes | 640 Views
This resource provides a comprehensive guide to analyzing wage distributions using stem-and-leaf diagrams. It includes a detailed example from a small factory's wage data, instructing learners to calculate the median, lower and upper quartiles, and the semi-interquartile range. Additionally, it explores the probability of randomly selecting an employee who earns less than £180, promoting practical learning in statistics. Perfect for students looking to master data representation and interpretation.

E N D
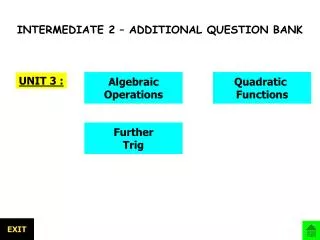
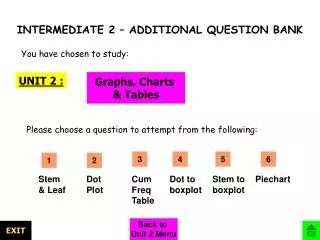
INTERMEDIATE 2 – ADDITIONAL QUESTION BANK You have chosen to study: Graphs, Charts & Tables UNIT 2 : Please choose a question to attempt from the following: 3 4 5 6 1 2 Stem & Leaf Dot Plot Cum Freq Table Dot to boxplot Stem to boxplot Piechart Back to Unit 2 Menu EXIT
GRAPHS, CHARTS, TABLES : Question 1 The following stem & leaf diagram shows the distribution of wages for employees in a small factory ….. 16 2 3 6 9 17 1 1 1 8 8 9 18 2 3 3 5 6 7 7 19 1 2 8 20 1 5 5 6 n = 25 21 817 4 = £174 (a) Use this information to find the (i) median (ii) lower & upper quartiles (iii) the semi-interquartile range • What is the probability that someone chosen at random earns less than £180? Go to full solution Get hint EXIT Go to Comments Reveal answer
GRAPHS, CHARTS, TABLES : Question 1 The following stem & leaf diagram shows the distribution of wages for employees in a small factory ….. 16 2 3 6 9 17 1 1 1 8 8 9 18 2 3 3 5 6 7 7 19 1 2 8 20 1 5 5 6 n = 25 21 817 4 = £174 Q1 is midpoint from start to median Q3 is midpoint from median to end Use median position = (n+1) / 2 to find median (a) Use this information to find the (i) median (ii) lower & upper quartiles (iii) the semi-interquartile range What would you like to do now? • What is the probability that someone chosen at random earns less than £180? Graphs etc Menu Go to full solution EXIT Go to Comments Reveal answer
GRAPHS, CHARTS, TABLES : Question 1 The following stem & leaf diagram shows the distribution of wages for employees in a small factory ….. 16 2 3 6 9 17 1 1 1 8 8 9 18 2 3 3 5 6 7 7 19 1 2 8 20 1 5 5 6 n = 25 21 817 4 = £174 median = £183 (a) Use this information to find the (i) median (ii) lower & upper quartiles (iii) the semi-interquartile range Q1 = £171 What would you like to do now? Q3 = £195 = £12 • What is the probability that someone chosen at random earns less than £180? = 2/5 Go to full solution EXIT Graphs etc Menu Go to Comments
Question 1 1. Use median = (n+1) / 2 to find median 16 2 3 6 9 17 1 1 1 8 8 9 18 2 3 3 5 6 7 7 19 1 2 8 20 1 5 5 6 n = 25 21 817 4 = £174 (a)(i) Since n = 25 then the median is 13th value (NOT 3!!!) ie median = £183 2. There are 12 values before median so Q1 position = 13 - (12 + 1) / 2 • Median • lower & upper quartiles • (iii) the semi-interquartile range (ii) Both 6th & 7th values are £171 so Q1 = £171 3. There are 12 values after median so Q3 position = 13 + (12 + 1) / 2 Begin Solution 19th is £192 & 20th is £198 so Q3 = £195 Continue Solution Comments Menu What would you like to do now? Back to Home
Question 1 4. Use SIQR = ½ (Q3 – Q1 ) / 2 (iii) SIQR = ½(Q3 – Q1) 16 2 3 6 9 17 1 1 1 8 8 9 18 2 3 3 5 6 7 7 19 1 2 8 20 1 5 5 6 n = 25 21 817 4 = £174 = (£195 - £171) 2 = £12 • Median • lower & upper quartiles • (iii) the semi-interquartile range Begin Solution Continue Solution Comments Menu Back to Home
Question 1 5. Use P = no of favourable / no of data No of favourable ( under £180) = 10 16 2 3 6 9 17 1 1 1 8 8 9 18 2 3 3 5 6 7 7 19 1 2 8 20 1 5 5 6 n = 25 21 817 4 = £174 No of data = n = 25 (b) Prob(under £180) = 10/25 = 2/5 . • What is the probability that • someone chosen at random • earns less than £180? Begin Solution Continue Solution Comments Menu Back to Home
Comments Median: the middle number in the ordered list. 25 numbers in the list. 1. Use median = (n+1) / 2 to find median (a)(i) Since n = 25 then the median is 13th value 1 – 12 13 14 - 25 ie median = £183 2. There are 12 values before median so Q1 position = 13 - (12 + 1) / 2 12 numbers on either side of the median median is the 13th number in order. (ii) Both 6th & 7th values are £171 so Q1 = £171 3. There are 12 values after median so Q3 = 13 + (12 + 1) / 2 19th is £192 & 20th is £198 so Q3 = £195 Next Comment Menu Back to Home
Comments To find the upper and lower quartiles deal with the numbers on either side of the median separately. 1. Use median = (n+1) / 2 to find median (a)(i) Since n = 25 then the median is 13th value Q1 12 numbers before median. 6 numbers either side of Q1 is midway between the 6th and 7th number. ie median = £183 2. There are 12 values before median so Q1 position = 13 - (12 + 1) / 2 (ii) Both 6th & 7th values are £171 so Q1 = £171 3. There are 12 values after median so Q3 = 13 + (12 + 1) / 2 19th is £192 & 20th is £198 so Q3 = £195 Next Comment Menu Back to Home
Comments To find the upper and lower quartiles deal with the numbers on either side of the median separately. 1. Use median = (n+1) / 2 to find median (a)(i) Since n = 25 then the median is 13th value Q3 12 numbers after median. 6 numbers either side of Q3 is midway between the 19th and 20th number. ie median = £183 2. There are 12 values before median so Q1 position = 13 - (12 + 1) / 2 (ii) Both 6th & 7th values are £171 so Q1 = £171 3. There are 12 values after median so Q3 = 13 + (12 + 1) / 2 19th is £192 & 20th is £198 so Q3 = £195 Next Comment Menu Back to Home
Charts, Graphs & Tables : Question 2 The weights in grams of 20 bags of crisps were as follows 28 29 29 30 31 30 28 30 29 28 29 30 30 28 28 29 29 29 29 28 a) Illustrate this using a dot plot. b) What type of distribution does this show? c) If a bag is chosen at random what is the probability it will be heavier than the modal weight? Go to full solution Get hint EXIT Go to Comments Reveal answer
Charts, Graphs & Tables : Question 2 The weights in grams of 20 bags of crisps were as follows 28 29 29 30 31 30 28 30 29 28 29 30 30 28 28 29 29 29 29 28 a) Illustrate this using a dot plot. b) What type of distribution does this show? c) If a bag is chosen at random what is the probability it will be heavier than the modal weight? Establish lowest & highest values and draw line with scale. Plot a dot for each piece of data and label diagram. For probability use: P = no of favourable / no of data What would you like to do now? Graphs etc Menu Go to full solution EXIT Go to Comments Reveal answer
Charts, Graphs & Tables : Question 2 The weights in grams of 20 bags of crisps were as follows 28 29 29 30 31 30 28 30 29 28 29 30 30 28 28 29 29 29 29 28 a) Illustrate this using a dot plot. b) What type of distribution does this show? c) If a bag is chosen at random what is the probability it will be heavier than the modal weight? CLICK Tightly clustered 3/10 Graphs etc Menu Go to full solution EXIT Go to Comments
Question 2 26 28 30 32 Weights in g 1. Establish lowest & highest values and draw line with scale. • 29 29 30 31 • 28 30 29 28 • 30 30 28 28 • 29 29 29 29 28 (a) Lowest = 28 & highest = 31. Illustrate this using a dot plot. Begin Solution 2. Plot a dot for each piece of data and label diagram. Continue Solution Comments Menu Back to Home
Question 2 26 28 30 32 Weights in g 3. Make sure you know the possible descriptions of data. • 29 29 30 31 • 28 30 29 28 • 30 30 28 28 • 29 29 29 29 28 What type of distribution does this show? Begin Solution Continue Solution (b) Tightly clustered distribution. Comments Menu Back to Home
Question 2 26 28 30 32 Weights in g 4. Use P = no of favourable / no of data • 29 29 30 31 • 28 30 29 28 • 30 30 28 28 • 29 29 29 29 28 Mode! If a bag is chosen at random what is the probability it will be heavier than the modal weight? Begin Solution No of favourable ( bigger than 29) = 6 Continue Solution No of data = n = 20 Comments (c) Prob(W > mode) = 6/20 = 3/10 . Menu What would you like to do now? Back to Home
Comments 26 28 30 32 Weights in g Other types of distribution: 3. Make sure you know the possible descriptions of data. Next Comment (b) Tightly clustered distribution. Menu Back to Home
Comments 26 28 30 32 Weights in g Other types of distribution: 3. Make sure you know the possible descriptions of data. Next Comment (b) Tightly clustered distribution. Menu Back to Home
Comments 26 28 30 32 Weights in g Other types of distribution: 3. Make sure you know the possible descriptions of data. Next Comment (b) Tightly clustered distribution. Menu Back to Home
Comments 26 28 30 32 Weights in g To calculate simple probabilities: 4. Use P = no of favourable / no of data Mode! Probability = Number of favourable outcomes Number of possible outcomes No of favourable ( bigger than 29) = 6 Next Comment No of data = n = 20 Menu (c) Prob(W > mode) = 6/20 = 3/10 . Back to Home
Charts, Graphs & Tables : Question 3 The results for a class test were 18 14 16 17 14 16 13 11 13 13 16 14 13 18 15 10 14 17 13 15 15 18 14 17 13 16 10 14 13 17 (a) Construct a cumulative frequency table for this data. (b) What is the median for this data? (c) What is the probability that a pupil selected at random scored under 14? Get hint Graphs etc Menu Go to full solution EXIT Go to Comments Reveal answer
Charts, Graphs & Tables : Question 3 The results for a class test were 18 14 16 17 14 16 13 11 13 13 16 14 13 18 15 10 14 17 13 15 15 18 14 17 13 16 10 14 13 17 (a) Construct a cumulative frequency table for this data. (b) What is the median for this data? (c) What is the probability that a pupil selected at random scored under 14? Establish lowest & highest values and draw table. Use median = (n+1) / 2 to establish in which row median lies. Complete each row 1 step at a time, calculating running total as you go. For probability use: P = no of favourable / no of data What would you like to do now? Graphs etc Menu Go to full solution EXIT Go to Comments Reveal answer
Charts, Graphs & Tables : Question 3 The results for a class test were 18 14 16 17 14 16 13 11 13 13 16 14 13 18 15 10 14 17 13 15 15 18 14 17 13 16 10 14 13 17 (a) Construct a cumulative frequency table for this data. (b) What is the median for this data? (c) What is the probability that a pupil selected at random scored under 14? CLICK Median = 14 1/3 Graphs etc Menu Go to full solution EXIT Go to Comments
Question 3 1. Establish lowest & highest values and draw a table. Mark Frequency Cum Frequency • 14 16 17 14 16 13 11 13 • 16 14 13 18 15 10 14 17 • 15 15 18 14 17 13 16 10 • 14 13 17 (a) Lowest = 10 & highest = 18 10 11 12 13 14 15 16 17 18 2 2 1 3 0 3 7 10 • Construct a cumulative • frequency table for this • data. 6 16 3 19 4 23 4 27 Begin Solution 3 30 Continue Solution Comments 2. Complete each row 1 step at a time, calculating running total as you go. Menu Back to Home
Question 3 3. Use median = (n+1) / 2 to establish in which row median lies. Mark Frequency Cum Frequency • 14 16 17 14 16 13 11 13 • 16 14 13 18 15 10 14 17 • 15 15 18 14 17 13 16 10 • 14 13 17 10 11 12 13 14 15 16 17 18 2 2 1 3 0 3 7 10 6 16 (b) What is the median for this data? 3 19 4 23 4 27 What would you like to do now? 3 30 Begin Solution Continue Solution For 30 values median is between 15th & 16th both of which are in row 14. Comments Menu Median Mark = 14 Back to Home
Question 3 Mark Frequency Cum Frequency 4. Use P = no of favourable / no of data • 14 16 17 14 16 13 11 13 • 16 14 13 18 15 10 14 17 • 15 15 18 14 17 13 16 10 • 14 13 17 10 11 12 13 14 15 16 17 18 2 2 1 3 0 3 7 10 6 16 (c) What is the probability that a pupil selected at random scored under 14? 3 19 4 23 4 27 What would you like to do now? 3 30 Begin Solution Continue Solution No of favourable ( under 14) = 10 Comments No of data = n = 30 (c) Prob(mark<14) = 10/30 = 1/3 . Menu Back to Home
Comments Mark Freq Cum Freq Median: 1 – 15 Q2 16 - 30 10 11 12 13 14 15 16 17 18 2 2 1 3 0 3 7 10 Median = 14 6 16 3 19 4 23 Find the mark at which the cumulative frequency first reaches between 15th and 16th number. 4 27 3 30 Next Comment For 30 values median is between 15th & 16th both of which are in row 14. Menu Median = 14 Back to Home
Comments Mark Freq Cum Freq To calculate simple probabilities: Probability = 10 11 12 13 14 15 16 17 18 2 2 1 3 Number of favourable outcomes Number of possible outcomes 0 3 7 10 6 16 3 19 4 23 4 27 3 30 No of favourable ( under 14) = 10 Next Comment No of data = n = 30 Menu (c) Prob(mark<14) = 10/30 = 1/3 . Back to Home
48 50 52 54 56 58 Charts, Graphs & Tables : Question 4 The dot plot below shows the number of matches per box in a sample of 23 boxes. • Find the(i) median (ii) lower quartile (iii) upper quartile • Construct a boxplot using this data. • In a second sample the semi-interquartile range was 2.5. How does this distribution compare to the above sample? Get hint Graphs etc Menu Go to full solution EXIT Go to Comments Reveal answer
48 50 52 54 56 58 Charts, Graphs & Tables : Question 4 The dot plot below shows the number of matches per box in a sample of 23 boxes. Q1 is midpoint from start to median Q3 is midpoint from median to end Use median position = (n+1) / 2 to find median remember bigger SIQR means more variation (spread) in data. • Find the(i) median (ii) lower quartile (iii) upper quartile • Construct a boxplot using this data. • In a second sample the semi-interquartile range was 2.5. How does this distribution compare to the above sample? What would you like to do now? Graphs etc Menu Go to full solution EXIT Reveal answer Go to Comments
48 50 52 54 56 58 Charts, Graphs & Tables : Question 4 The dot plot below shows the number of matches per box in a sample of 23 boxes. Median = 50 So Q1 = 49 So Q3 = 52 • Find the(i) median (ii) lower quartile (iii) upper quartile • Construct a boxplot using this data. • In a second sample the semi-interquartile range was 2.5. How does this distribution compare to the above sample? CLICK the data is distributed more widely than (or not as clustered as) the above data EXIT Full solution Comments Menu
Question 4 1. Use median = (n+1) / 2 to find median 48 50 52 54 56 58 • (i) Sample size = 23 • so median position is 12. • ie (23+1)2 Median = 50 2. There are 11 values before median so Q1 position = 12 - (11 + 1) / 2 • Find the(i) median • (ii) lower quartile • (iii) upper quartile (ii) Middle of 1st 11 is position 6. So Q1 = 49 Begin Solution 3. There are 11 values after median so Q3 position = 12 + (11 + 1) / 2 Continue Solution Comments (iii) Middle of 2nd 11 is position 18. Menu So Q3 = 52 Back to Home
Question 4 48 50 52 54 56 58 48 50 52 54 56 58 4. Draw number line with scale. Make sure you note highest & lowest as well as Q1, Q2, Q3. • Lowest = 48, Q1 = 49, Q2 = 50, • Q3 = 52 & Highest = 58. (b) Construct a boxplot using this data. Begin Solution Continue Solution Comments Menu Back to Home
Question 4 48 50 52 54 56 58 5. Calculate SIQR then compare remember bigger SIQR means more variation (spread) in data. • For above sample • SIQR = (52 - 49) 2 = 1.5 In a sample where the SIQR is 2.5 the data is distributed more widely than (or not as clustered as) the above data (c) In a second sample the semi-interquartile range was 2.5. How does this compare? What would you like to do now? Begin Solution Continue Solution Comments Menu Back to Home
Comments The median: 1. Use median = (n+1) / 2 to find median 23 numbers in the list: • (i) Sample size = 23 • so median position is 12. • ie (23+1)2 1 - 11 12 13 - 23 Q2 Median = 50 2. There are 11 values before median so Q1 position = 12 - (11 + 1) / 2 11 numbers on either side of the median (ii) Middle of 1st 11 is position 6. So Q1 = 49 3. There are 11 values after median so Q3 position = 12 + (11 + 1) / 2 Next Comment (iii) Middle of 2nd 11 is position 18. Menu So Q3 = 52 Back to Home
Comments For quartiles: 1. Use median = (n+1) / 2 to find median • (i) Sample size = 23 • so median position is 12. • ie (23+1)2 1 - 5 6 7 - 11 12 Q2 Q1 Median = 50 12 13 - 17 18 19 - 23 2. There are 11 values before median so Q1 position = 12 - (11 + 1) / 2 Q3 Q2 (ii) Middle of 1st 11 is position 6. Now count through the list until you reach the 6th, 12th,and 18th number in the list. So Q1 = 49 3. There are 11 values after median so Q3 position = 12 + (11 + 1) / 2 Next Comment (iii) Middle of 2nd 11 is position 18. Menu So Q3 = 52 Back to Home
Comments 1 2 S.I.R. = (Q3 - Q1) The semi-interquartile range is a measure of the range of the “middle” 50%. 5. Calculate SIQR then compare remember bigger SIQR means more variation (spread) in data. • For above sample • SIQR = (52 - 49) 2 = 1.5 It is a measure of how spread-out and so how “consistent” or “reliable” the data is. In a sample where the SIQR is 2.5 the data is distributed more widely than or not as clustered as the above data Remember: when asked to compare data always consider average and spread. Next Comment Menu Back to Home
6 0 2 7 1 3 5 7 7 8 2 2 2 5 6 6 8 9 9 4 4 6 9 9 10 5 7 7 11 12 1 1 3 11 4 = 114kg 60 70 80 90 100 110 120 Charts, Graphs & Tables : Question 5 The stem & leaf diagram below shows the weight distribution of 26 people when they joined a slimming club. Get hint Reveal answer Full solution Comments • Find themedian, lower & upper quartiles for this data. • Use the data to construct a boxplot. • The boxplot below shows the weight distribution for these people after several months. Compare the two & comment on the results. EXIT
6 0 2 7 1 3 5 7 7 8 2 2 2 5 6 6 8 9 9 4 4 6 9 9 10 5 7 7 11 12 1 1 3 11 4 = 114kg 60 70 80 90 100 110 120 Charts, Graphs & Tables : Question 5 What now? The stem & leaf diagram below shows the weight distribution of 26 people when they joined a slimming club. Q1 is midpoint from start to median Q3 is midpoint from median to end Use median position = (n+1) / 2 to find median position Menu When comparing two data sets comment on spread and average Reveal answer Full solution Comments • Find themedian, lower & upper quartiles for this data. • Use the data to construct a boxplot. • The boxplot below shows the weight distribution for these people after several months. Compare the two & comment on the results. EXIT
6 0 2 7 1 3 5 7 7 8 2 2 2 5 6 6 8 9 9 4 4 6 9 9 10 5 7 7 11 12 1 1 3 11 4 = 114kg 60 70 80 90 100 110 120 Charts, Graphs & Tables : Question 5 The stem & leaf diagram below shows the weight distribution of 26 people when they joined a slimming club. median = 87 Menu Q1 = 77 Q3 = 99 Full solution Comments • Find themedian, lower & upper quartiles for this data. • Use the data to construct a boxplot. • The boxplot below shows the weight distribution for these people after several months. Compare the two & comment on the results. CLICK CLICK EXIT
Question 5 6 0 2 7 1 3 5 7 7 8 2 2 2 5 6 6 8 9 9 4 4 6 9 9 10 5 7 7 11 12 1 1 3 11 4 = 114kg 1. Use median = (n+1) / 2 to find median (a)(i) Since n = 26 then the median is between 13th & 14th value ie median = 87 2. There are 13 values before median so Q1 position is 6th value • Find themedian, lower & • upper quartiles for this data. (ii) so Q1 = 77 3. There are 13 values after median so Q3 position is 20th position Begin Solution so Q3 = 99 Continue Solution Comments Menu Back to Home
Question 5 4. Draw number line with scale. Make sure you note highest & lowest as well as Q1, Q2, Q3. 6 0 2 7 1 3 5 7 7 8 2 2 2 5 6 6 8 9 9 4 4 6 9 9 10 5 7 7 11 12 1 1 3 11 4 = 114kg 60 70 80 90 100 110 120 • Lowest = 60, Q1 = 77, Q2 = 87, • Q3 = 99 & Highest = 123. (b) Use the data to construct a boxplot. Begin Solution Continue Solution Comments Menu Back to Home
Question 5 5. Compare spread and relevant average. 60 70 80 90 100 110 120 (c) The boxplot below shows the weight distribution for these people after several months. Compare the two & comment on the results. • Lightest has put on weight – • lowest now 65, • heaviest 3 have lost weight – • highest now 115, • median same but overall • spread of weights has decreased • as Q3-Q1 was 22 • but is now only 15. Begin Solution Continue Solution What would you like to do now? Comments Menu Back to Home
Comments 60 70 80 90 100 110 120 Remember: To draw a boxplot you need a “five-figure summary”: 4. Draw number line with scale. Make sure you note highest & lowest as well as Q1, Q2, Q3. • Lowest = 60, Q1 = 77, Q2 = 87, • Q3 = 99 & Highest = 123. Box Plot : Lowest Q1 Q2 Q3 Highest five-figure summary Next Comment Menu Back to Home
Watching TV cinema x° theatre 144° clubbing Charts, Graphs & Tables : Question 6 The pie chart below shows the breakdown of how a sample of 630 people spent their Saturday nights. • How many people • went clubbing? • (b) If 84 people went to the • theatre then how big is x°? Get hint Graphs etc Menu Go to full solution EXIT Go to Comments Reveal answer
Watching TV cinema angle = x° theatre 360° 144° clubbing amount 630 Charts, Graphs & Tables : Question 6 The pie chart below shows the breakdown of how a sample of 630 people spent their Saturday nights. • How many people • went clubbing? • (b) If 84 people went to the • theatre then how big is x°? What would you like to do now? Graphs etc Menu Go to full solution EXIT Go to Comments Reveal answer
Watching TV cinema x° theatre 144° clubbing Charts, Graphs & Tables : Question 6 The pie chart below shows the breakdown of how a sample of 630 people spent their Saturday nights. • How many people • went clubbing? • (b) If 84 people went to the • theatre then how big is x°? = 252 = 48° What would you like to do now? Graphs etc Menu Go to full solution EXIT Go to Comments
Question 6 Watching TV cinema angle 144° = = x° theatre 360° 360° 144° clubbing amount amount 630 630 1. Set up ratio of angles and sectors and cross multiply. (a) The angle is 144° so ….. 360 x amount = 144 x 630 How many people went clubbing? amount = 144 x 630 360 = 252 Begin Solution Continue Solution Comments Menu Back to Home
Question 6 Watching TV cinema angle angle = = x° theatre 360° 360° 144° clubbing amount 84 630 630 2. Set up ratio of angles and sectors and cross multiply. (b) The amount is 84 so ….. 630 x angle = 360° x 84 (b) If 84 people went to the theatre then how big is x°? angle = 360° x 84 630 = 48° Begin Solution Continue Solution Comments Menu Back to Home
Comments 144° angle = = 360° 360° 144 360 amount amount 630 630 Can also be tackled by using proportion: 1. Set up ratio of angles and sectors and cross multiply. (a) The angle is 144° so ….. Amount = x 630 360 x amount = 144 x 630 amount = 144 x 630 360 = 252 Next Comment Menu Back to Home