Download
1 / 39
400 likes | 628 Views
Transwestern Pipeline Company. Rating Agency Presentation February 2002. Table of Contents. Revolving Credit Agreement. $550 million, 364-day facility secured by pipeline assets and pledge of stock; libor + 250 Guaranteed by ENE; amendment forthcoming Fully drawn on Nov. 13, 2001

E N D
TranswesternPipelineCompany Rating Agency Presentation February 2002
Revolving Credit Agreement • $550 million, 364-day facility secured by pipeline assets and pledge of stock; libor + 250 • Guaranteed by ENE; amendment forthcoming • Fully drawn on Nov. 13, 2001 • Proceeds loaned to ENE (unsecured claim) • Key Covenants • Kevin to fill in • Events of Default • Restructured payments • Default under ENE revolving credit facility • Minimum consolidation tangible net worth of $750 million • Current “Ring Fencing” of cash prohibits all loans/distributions
Liquidity • Additional borrowing capacity of $ • Excess cash flow per month ?? • Pre-Red Rock in-service $?? • Post-Red Rock in-service $?? • Projected cash balances • $?? at June 30, 2002 • $?? at Sept. 30, 2002 • $?? at Dec. 31, 2002
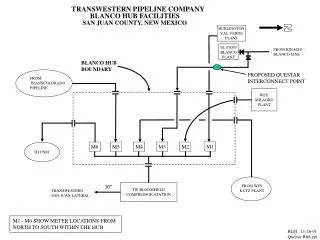
System Map See Kim Watson
Enron Restructuring Plan • Stephen Cooper named interim CEO and Chief Restructuring Officer • Develop and implement comprehensive restructuring plan for Enron (Isn’t this the impetus of the slide?) • Renewed focus on hard assets with predictable revenues and cash flows • Leverage commercial, regulatory and operational expertise • Continued growth in Enron’s pipelines See Steve Young Access to capital for regulated pipelines driven by current credit ratings
Bankruptcy Remote Structure Enron Transportation Services Wilmington Trust Company 100% Voting Trustee 200 shares of common stock Transwestern Holding Company, Inc TPC Voting Trust 800 shares of common stock Pledge of TW stock Lenders Transwestern Pipeline Company
Key Terms and ConditionsVoting Trust Agreement • 200 shares of TW held in voting trust • Trust is a Delaware statutory business trust • Voting trust stock and remaining TW stock pledged to paying agent • Voting trustee shall vote to disapprove of the following: • Certain changes to TW’s Certificate of Incorporation • Merger/consolidation; sale/lease of all TW assets • Dissolve/liquidate TW; file voluntary bankruptcy • Authorization/issuance of additional common stock of TW • Voting trust agreement and stock pledge agreement shown in Appendix
Industry Environment • Market area trends • California markets • Arizona, New Mexico and southern Nevada markets • Supply area trends • San Juan Basin • Permian and Anadarko Basins
Growing California Markets for Natural Gas • California’s natural gas use will increase from 6,400 MMcfd in 2000 to 7,500 MMcfd in 2010 • 110,000 MMcfd annual average increase (NEED TO VERIFY) • 2.5% projected annual average demand growth for electric generation • All expansion activity based upon long-term, firm transportation contracts Source: California Energy Commission
California Demand for Southwest Supplies Source: California Energy Commission
Hydro Coal Nuclear Oil Gas Growing Power Generation Markets for Natural GasArizona, New Mexico and Nevada Existing Generation Mix 24,204 MW 2009 Generation Mix 35,967 MW 24% Gas 49% Gas Source: ????
San Juan Basin Forecast • Basin production peaked in 1999 at 4.3 Bcfd • 2.4% decline by 2010 to 3.5 Bcfd • Transwestern is positioned to supplement its San Juan lateral supplies with Rockies gas via NWPL and TransColorado interconnects Source: Lippman Consulting, Inc.
Canadian Gas Flow Impact on California Decrease Canadian Supplies to California Increase Canadian Supplies to Chicago MMBtu/d Increase Rockies to California Decrease Permian & G.C. Supplies to MidContinent Increase Permian & Anadarko to California Permian and Anadarko Supplies Shift • Canadian supplies shift to Mid-continent • Transwestern receives increased Permian and Anadarko supplies via East of Thoreau interconnects • Relieves excess capacity challenge in Northern California
Competitive Environment • Other pipelines in market areas • Deliverability at California border • Comparative rates • Expansions • Proposed expansions to California • Transwestern expansion projects
Current Interstate Pipelines to California See Kim Watson
WA 200,000 MMBtu/d PGT OR ID Kern WY Southern Trails NV EPNG 1,010,000 MMBtu/d UT TWPL CO CA 120,000 MMBtu/d OK 150,000 MMBtu/d AZ NM TX 230,000 MMBtu/d Proposed Expansions to CaliforniaFiled with FERC
Proposed Expansions to California See Kim Watson Note: Needs to mention CA take away & bottleneck at the border
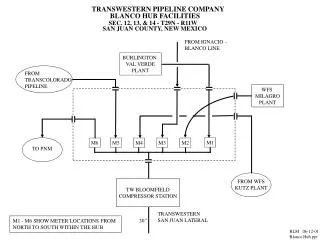
Nevada Utah Colorado California 1 2 3 New Mexico Arizona Texas Red Rock Expansion • Incremental 120,000/d delivered to California & Arizona for 1.210 Bcf/d total deliveries West • 106,700/d subscribed, resulting in 17.2% ROE (15.5% DCF) • Additional ?? HP at Stations 1, 2 &3 • Supplies from Permian & Anadarko basins • In-service June, 2002 • Cost = $93 million; funded from free cash flow • Key Shippers • PPL • Calpine • BP Energy • Western • Frito Lay
TransPecos Project Nevada Utah Colorado NNG California Kansas New Mexico Oklahoma TWPL Arizona TransPecos Texas • Proposed TW joint venture with Kinder Morgan • 176 mile, 24” pipeline from Ward County, TX to Hudspeth County, TX • 311,000/d capacity to serve Mexican markets • $130.9 million capital expenditure • Negotiating 240,000/d, 20 year firm contract with Pemex at $0.261 • Provides Pemex with supply diversity for growing load NGPL
Nevada Utah Colorado California Kansas Arizona New Mexico Oklahoma TWPL Sun Devil Phoenix Texas Sun Devil Project • New supply to new markets • $911 million capital cost • New 500 mmcfd capacity to Phoenix • +780,000/d Blanco to Thoreau on TW • +330,000/d to CA border on TW • New pipe and “linear storage” • Key shippers include: • Panda • Arizona Public Service
Revenue Generation • Sources of income • Breakdown of sources (relative %) • Top shippers ($, volume, contract tenor) • Highlights of FT contract structure • Historical breakdown of FT/IT
Transportation Demand Margin Growth • Total transportation margin increased 10% in 2001 due to ???? $130 Million Demand $137 Million Demand $146 Million Demand See Kim Watson
2002 Gross Margin by Type Operational Gas Sales 16% Demand 80% New Contracts & Commodity 4%
Top 10 Customers by Revenue in 2001 See Jim Saunders or Gary Zahn
Firm Transportation Contract Structure • Definitions • Firm Transportation: Guaranteed 365 days a year. Service cannot be interrupted except for an event of force majeure. • Maximum Daily Transportation Quantity (MDQ): Amount of pipeline capacity reserved for shipper on firm basis. • Demand (or Reservation) charge: The rate multiplied by the MDQ to derive the amount to be paid to Transwestern for the term of the agreement, regardless of usage. • Commodity (Usage charge: The rate multiplied by the quantity actually scheduled for transportation each day under the agreement. • Term: The start and end date of the agreement • Character of Service • The shipper under a firm transportation service agreement “owns” the capacity (its MDQ) on Transwestern’s system. Transwestern reserves such capacity for the shipper as well as guaranteeing delivery of gas scheduled under the agreement. In exchange for this reservation and guarantee of service, the shipper pays Transwestern a demand charge for such capacity whether or not it is utilized.
Capacity Subscription Level By Segment • Weighted average contract term of nearly 9 years • Mainline West 85% subscribed on average through 2005 • Blanco to Thoreau 93% subscribed on average through 2005 % of Revenue
Increasing Load Factors & Throughput Growth West 98% East 68% West 90% East 61% West 89% East 63%
Marketing Strategy Risk Management • Manage operational gas sales, incorporating price hedges or selling month-to-month as necessary, to generate incremental revenue • Determine optimum mix of index to index & fixed rates for re-subscription of capacity to generate additional income • Projected 92% average west throughput of 1.044 Bcfd (excluding Red Rock construction outages) • Manage commodity risk through weather hedges, if possible • Minimize risk under existing or new services: • Operational & financial management of gas inventory • Manadatory OBA cash-out in constrained areas • Scheduling alternate FT by price • Charge a fee for restructured pooling services
Marketing Strategy (continued) Capacity Re-subscription Negotiations • Negotiate rollover of ROFR contracts prior to trigger dates • Maximize opportunities for incremental 50,000/d take-away at Needles • Continue expansion strategy to enhance supply/market access • Virtual expansion via NNG to create West Texas capacity
Current Regulatory Regime • Transwestern’s current transportation environment has been shaped by three major regulatory rate filings, as reflected in TW’s currently effective FERC tariff • TW’s 1993 Rate Case Settlement (Docket Nos. RP93-34, et.al) • TW’s 1995 Global Settlement (Docket No. RPP95-271-000) • TW’s 1996 Mini Settlement (Docket Nos. RP95-271, et.al.)
Rate Case Overview • Rate Method • Transwestern’s currently effective tariff rates implemented under the 1993 Rate Case Settlement use the Straight Fixed Variable (SFV) rate design mandated by FERC Order No. 636 • Transwestern also has in effect its Settlement Base Rates (SBR), which were implemented under its Global and Mini- Settlements (Docket Nos. RP95-271, et.al.). The SBRs are applicable to seven specific shippers, identified in the Global and Mini- Settlements as “Current Firm Customers” or “CFC.” • Current Rate Structure – Revenue Requirement • Transwestern’s current revenue requirement was established under Docket No. RP93-34 and amended by Docket Nos. RP95-271, et.al. is as follows: Adjusted FTS-1 Reservation Charge Revenue $134.8 FTS-1 Commodity Charge Revenue $ 5.9 ITS-1 (Allocated from FTS-1 Demand)$ 6.1 Total Revenue Requirement $146.8 * NOTE: The parties to the Global and Mini- Settlements did not stipulate to the Cost of Service underlying the Settlement Base Rates.
Rate Case Overview (con’t) • 1993 Rate Case Settlement • FERC approved March 30, 1994 • SFV Rate Design • Additive zone based rates by path (see table 1) • Rates effective April 1, 1994 • General rate increase moratorium until November 1, 1996 • Next rate case to be effective no later than April 1, 1998
Rate Case Overview (con’t) • 1995 Global Settlement • FERC approved July 27, 1995 • Established Settlement Base Rates (SBR) applicable to specified Current Firm Customers (see table 2) for the term of each CFC’s service agreement, subject to an escalation factor beginning November 1, 1998 • Resolved (1) Southern California Gas Company’s (SoCal) turnback capacity (457,281 MMBtu) costs; (2) all issues pertaining to the recovery of take-or-pay costs; (3) all issues with respect to the then pending certificate proceedings (which included abandonment of gathering facilities); and (4) issues related to the Commission’s mandated SFV Rate Design under Order No. 636 • Settlement Base Rates effective November 1, 1996 • Established a Shared Cost Surcharge for CFCs to recover the following percentages of turnback capacity costs: • 50% TW/50% CFC from Nov. 1, 1996 through Oct. 31, 1997 • 75% TW/25% CFC from Nov. 1, 1997 through Oct. 31, 2001 • 100% TW/0% CFC from Nov. 1, 2001 forward (TW absorbs entire costs) • Next rate filing to be effective no later than November 1, 2006
Rate Case Overview (con’t) • 1995 Mini Settlement • FERC approved October 16, 1996 • Same term as Global Settlement • Issues involved: • Resolved all issues involving recovery of un-recovered Purchase Gas Adjustment Costs • Adjusted and finalized all issues relating to take-or-pay, buy-out, buy-down, and contract reformation costs • Reduced the depreciation of Mainline transmission facilities from 1.7% to 1.2%, effective January 1, 1996 • Provided a rate adjustment to the Global Settlement Base Rates • Established an Amortization Mechanism for certain costs
Rate Case Overview (con’t) • Next Rate Case – Expected changes • A general rate case filing must be filed to become effective no later than November 1, 2006 • All remaining Current Firm Customers’ service agreements will expire within six months of the effective date of the next rate case • Costs allocations could be affected by any imposed FERC rulings • Regulatory Trends/Outlook • FERC Order No. 637: Transwestern currently has a compliance filing pending at the FERC • The major issues include segmenting and mandatory cash-outs for imbalances
TABLE 1: 1993 Rate Case Settlement – Maximum Transportation Tariff Rate Matrix
TABLE 2: 1995 Global Settlement – Base Rates as Adjusted by 1996 Mini-Settlement