Download
1 / 20
200 likes | 291 Views
Use of Mechanistic Modeling to Enhance Derivation of Great Bay TN Criteria and Inform Restoration Strategy Thomas W. Gallagher, P.E. Cristhian A. Mancilla, EIT. Southeast Watershed Alliance Symposium May 11, 2011. Stressor-Response Regression Analysis.

E N D
Use of Mechanistic Modeling to Enhance Derivation of Great Bay TN Criteria and InformRestoration StrategyThomas W. Gallagher, P.E.Cristhian A. Mancilla, EIT Southeast Watershed Alliance SymposiumMay 11, 2011
Stressor-Response Regression Analysis • Regresses response variable (high chla, low DO, eelgrass decline) to stressor (nutrients). MAJOR ASSUMPTION: Other factors not significantly influencing “dose:response” • Empirical relationship (Vollenweider and others) of lake chla to lake phosphorus have been successfully applied for over 40 years. • Stressor-response relationships for rivers and estuaries have been more problematic. • Primary difficulties have been the proper consideration of other factors that influence the stressor-response relationship and the covariance across some stressors.
Mechanistic Modeling • Relates response variables to stressor with consideration of site specific physical, chemical, and biological factors. • Example: Low DO due to algal photosynthesis and respiration, BOD oxidation, nitrification, sediment oxygen demand and atmospheric reaeration. • Requires a considerable amount of data in comparison to the stressor-response approach. • More expensive than stressor-response approach but yields more scientifically defensible results; however, frequently beyond the budget of many regulatory agencies.
EPA Science Advisory Board Stressor Response Observations • “In order to be scientifically defensible, empirical methods must take into consideration the influence of other variables…. The statistical methods in the Guidance require careful consideration of confounding variables before being used as predictive tools. … Without such information, nutrient criteria developed using bivariate methods may be highly inaccurate.” SAB Stressor Response Review – April 27, 2010
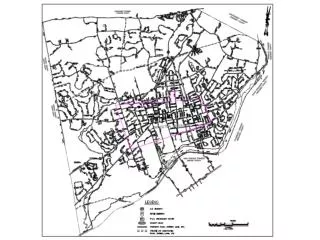
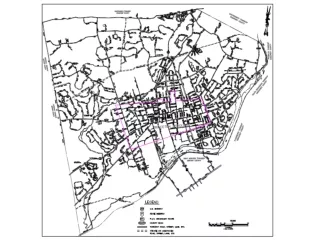
Trend Monitoring Stations for Water Quality in the Great Bay Estuary(New Hampshire DES, 2009)
Relationship between Light Attenuation Coefficient and TN at Trend Stations(New Hampshire DES, 2009) 0.75
Relationship between Turbidityand TN at Datasonde Stations(New Hampshire DES, 2009)
Contributions to Kd (PAR) measured at the Great Bay Buoy(From Morrison et al, 2008)
Relationship between Minimum DO and Chlorophyll-a at Trend Stations(New Hampshire DES, 2009) Coastal Bay Tidal River • Other factors: • - Residence time • - Reaeration • - SOD • - BOD oxidation • -Stratification
DO at the Squamscott River DatasondeJuly 2008 DO (%) DO (mg/L) Depth Salinity
DO at the Squamscott River DatasondeJuly-October 2009(New Hampshire DES, 2011)
Factors InfluencingWater Column Dissolved Oxygen Water column stratification Residence Time Reaeration Algal photosynthesis and respiration BOD5 BOD5 DO Nitrogen Phosphorus NH4 SOD
Recommendations • Continue to look for other factors responsible for eelgrass decline other than changes in water column light transparency. • To better understand the factors responsible for low DO in tributaries to Great Bay, perform a data collection effort to support mechanistic modeling. • Start with Squamscott River DO model to address Exeter permit issues.
Relationship between TN and Chlorophyll-a at Trend Stations(New Hampshire DES, 2009)
COASTAL MARINE LABORATORY 90th chla = 9.3 ug/L Median TN = 0.39 mg/L GREAT BAY DATASONDE 90th chla = 7.5 ug/L Median TN = 0.45 mg/L LAMPREY RIVER DATASONDE • Daily Minimum DO, Jun-Sep2000-2008(New Hampshire DES, 2009) 90th chla = 13.7 ug/L Median TN = 0.52 mg/L SALMON FALLS RIVER DATASONDE 90th chla = 3.3 ug/L Median TN = 0.30 mg/L 90th chla = 14.3 ug/L Median TN = 0.57 mg/L OYSTER RIVER DATASONDE 90th chla = 12.1 ug/L Median TN = 0.74 mg/L SQUAMSCOTT RIVER DATASONDE
Key Transparency Issues to Resolve • Did Bay transparency significantly change over time? • Degree of a 1-2 ug/l Chlorophyll a change on long term average transparency? • Degree of chlorophyll a reduction achievable with TN control considering bay hydrodynamics? • Does pattern of eelgrass loss fit transparency theory? • Are other factors at play in eelgrass decline?
Summary statistics for DO and chlorophyll-a for grab samples collected from 2000-2008 grouped by assessment zone (NH DES. 2009. Figure 26)Predicted threshold for DO violations: Chl-a (90th %ile) > 7 ug/L