Download
1 / 10
100 likes | 243 Views
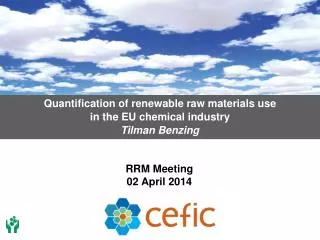
Quantification of renewable raw materials use in the EU chemical industry Tilman Benzing. RRM Meeting 02 April 2014. Motivation for raw materials quantification . K now the status of bio-based chemical production - as baseline information

E N D
Quantification of renewablerawmaterials use in the EU chemicalindustry Tilman Benzing RRM Meeting 02 April 2014
Motivation for raw materials quantification • Know the status of bio-based chemical production • - as baseline information • - to monitor future developments • Aggregate chemical productionis difficult to quantify • - Value: possible • - Volume: impossible! • Scope and methodology • - Raw materials entering the chemical industry • - Limitation to organic materials and material use
Scopeandmethodology Customer industries (e.g. Packaging, Construction, Automotive, Cleaning, Pharmaceutical) Simplified; proportions not toscale! = not takenintoaccount Chem. industryEnergyuse Chemical industry (NACE 20) Plastics, Fine andspecialtychemicals Raw Materials Base Chemical Value Chain Organicbasechemicals Inorganicbasechemicals Coaltar Bioethanol Vegetableoils, Animalfats, Cellulose, Sugar, Starch, Bioethanol, Natural Rubber, Glycerol, andothers = internalenergyuse in crackers Salt, phosphate, flurospar, lithium, potassium, pre- ciuosmetals, andmanyothers Naphtha, condensates, LPG, gasoil Bio-basedrawmaterials Coal Mining Natural gas production Refineries Inorganicsmining
Organic raw material use Draft results volume Volume in 1.000 t – material (feedstock) use only, EU chemical industry, 2011 derivatives
Organic raw material useDraft results shares Shares in total organic raw materials – material (feedstock) use only, EU chemical industry, 2011 derivatives
Renewables volume: Detailed breakdown (draft) Renewables volume in 1.000 tonnes, EU chemicalindustry, 2011 Vegetable waxes, natural resins, tanning agents, proteins, medicinal plants
Renewables shares: Detailed breakdown (draft) Renewablesshares in total renewables, EU chemicalindustry, 2011 total: 8.5 mill. tonnes/a (for ETBE) Vegetable waxes, natural resins, tanning agents, proteins, medicinal plants
Limitations • Methodology: Definition of scope influences the results • Varying data quality: Different sources, estimates • The results are an important step towards a baseline for monitoring the future development of bio-based chemical production, but should not be seen as complete and as a definitive baseline. • Changes in scope and methodology as well as changes in data sources and estimates could lead to structural changes in the data, limiting the validity of future monitoring. • These uncertainties require careful interpretation of the resulting data, especially when analyzing future developments.
Way forward • Regular updates, beginning with 2012 data • Regular screening of data sources to improve data quality: • - substitution of sources with better ones • - replacement of estimates by systematic and regular surveys, where possible • Possible adaptation of methodology in light of new information • Possible application as template for member states to be discussed with national federations, taking into account existing approaches and methodologies. Thankyouforyourattention!