Download
1 / 19
190 likes | 230 Views
Explore heat transfer through windows using finite element modeling. Compare with NFRC results for energy-efficient designs.

E N D
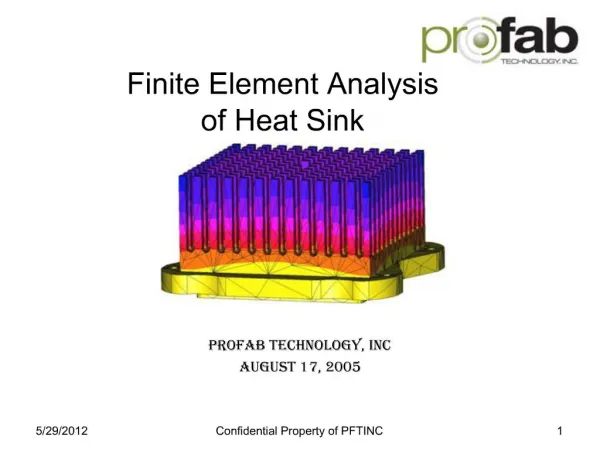
Building Energy Research Laboratory Department of Mechanical and Industrial Engineering University of Massachusetts Amherst Heat Transfer AnalysisFor The Fenestration System -Simulation Round Robin 1998-99Using Finite Element Method MIE 605 FINITE ELEMENT ANALYSIS Prof. Dr. Ian Grosse Submitted by Petar Blanuša
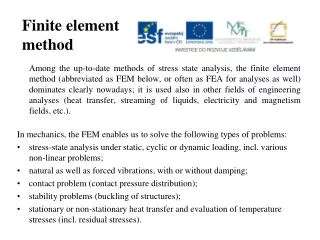
Project Outline • Introduction • Problem Definition • Objective • Physical System Definition • Conduction model • Finite Element Model • Mesh • Results • Conclusions/Future Work
Introduction • Improving the thermal performance of building envelope (walls, windows, doors, ceilings, attics, roofs, etc.). • Computer modeling vs. experimental measurements • Comparison of the same product easier
Objective • This computer finite element calculation will be used to: • Show temperature and heat flux distribution. • Obtaining heat flows through the window. • Calculation of ASHRAE based U-factor. • Comparison to other labs results in NFRC simulation RR
1. HEAT CONDUCTION • only energy equation is present • since there is solid body • 2. THERMAL TRANSMITTANCE(to take into account frame effects) • The governing equation is developed by imposing energy-balance which describes steady-state heat transfer by conduction. • Must specify the frame/edge-glass geometry and the corresponding thermal conductivity for each of the various materials. • Numerical solver of the FEA software (THERM 2.0®) is generating 2-D heat flow and temperature that satisfy the governing equation (by ISO 15099 Standard). In Cartesian coordinates this equation is: • 3. HEAT FLUXq, must be conserved across any surface where two materials meet and is given by: • where ex and ey are the components of the normal vector to the surface. Mathematical ModelGoverning Equations
All materials in this window are treated as having constant properties. Material Properties
Boundary Conditions
Software THERM - Detailed finite element analysis of the two dimensional (2-D) heat transfer of fenestration product is done by public domain software THERM 2.0(LBNL, 1998) Window 4.1 - PC based program used to calculate total window thermal performance indices (i.e. U-values, solar heat gain coefficients, shading coefficients and visible transmittance). (LBNL, 1994)
RESULTS-Isotherms 1. Useful for predicting extreme temperature gradients (isotherms are very close together) that may lead to thermal stress or structural problems. 2. Isotherms are also useful for identifying hot or cold areas in the cross section, in order to predict thermal degradation or condensation.
Color Infrared Results - Temperature gradients in the cross sections. - Each temperature is represented by a different color - Cooler colors (purples and blues) are low temperatures, and warmer colors (yellows and reds) are higher temperatures.
Color Flux Magnitude - Results • Represent the heat flux vectors, with the magnitude of the flux represented by color • Cooler colors are low flux (purples and blues) • Warmer colors are higher flux (yellows and reds). • No indication of the flux direction
Results WINDOW 4.1 Report 04/18/99 12:51:56 ID:22 FrID: 24 FrID: 28 Name:Al - Double =============================== Mode:Design || || || EnvCond:1 ||GlzSysID: 23#||GlzSysID: 23#| || Wid:660.6mm|| Wid:708.1mm|| Type:Horz Slider FrID: 25|| Div ID: 12 || Div ID: 12||FrID: 29 Tilt: 90 || #H: 2 #V: 2 || #H: 2 #V: 2|| Size:Horz Slid AA || || || Width:1524.00mm || FrID: 27 || Height: 914.40mm || || || Area: 1.39 m2 =============================== FrID: 26 FrID: 30 U-value: 3.520 W/m2-C SC: 0.482 SHGC: 0.414 Vt: 0.276
Results (cont.) (FEA Therm analysis results assembled in Window 4.1)
Future work - Creation of three-dimensional (3-D) geometry of selected fenestration system - Finite element heat transfer calculations of selected fenestration system - Comparison of obtained results with two-dimensional (2-D) heat transfer analysis results - Comparison with experimental measurements - Developing correlation for 2-D heat transfer analysis results to account for 3-D effects