Download
1 / 36
400 likes | 678 Views
From Clinical Observations to Research Hierarchy of Study Designs. Dr. Dick Menzies June 10 th , 2005. Overview of study designs. Observational Studies Descriptive studies Case reports Case series Reported data Cross sectional studies Ecologic studies Analytic studies

E N D
From Clinical Observations to ResearchHierarchy of Study Designs Dr. Dick Menzies June 10th, 2005
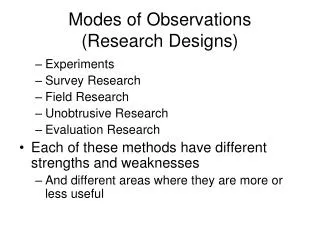
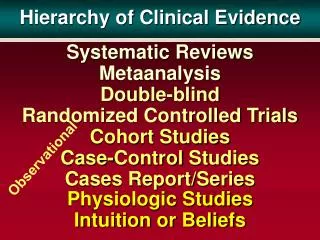
Overview of study designs • Observational Studies • Descriptive studies • Case reports • Case series • Reported data • Cross sectional studies • Ecologic studies • Analytic studies • Case control studies • Cohort studies • Diagnostic test evaluations • Experimental studies • Randomized control trials – individual level • Field trials - community or group level
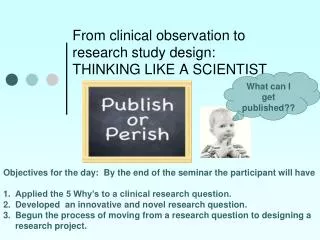
Step 1: Case Reports • Report of a single occurrence of new disease or unusual occurrence of a known disease • Eg., Pneumocystis pneumonia in young homosexual men. • Pulmonary embolus in young woman on oral contraceptives • Myocardial infarction in a child • Strengths – rapid and cheap • Useful to alert community to a new disease • This is useful if others are seeing the same thing. • Weaknesses – rare events do happen! • Someone always wins the lottery • Clinicians have to recognize and diagnose the disease • Have to recognize that it is unusual.
Step 2: Small case series • This means 3 or more of the same condition • Unusual events - as for case reports • Generally adds a little more than case reports • More cases equals potentially more weight • But, rare events can happen - in clusters • 3 cases of Angiosarcoma in workers from a PVC factory • Three people on same street win lottery • Both of these occurred. Which do you think was due to chance alone?
Step 3: After the case report/case series. Need to review and understand disease • 1 Case definition • Who gets it, clinical features, outcomes? • The more detailed the better (autopsy) • 2 What is or appears to be the biology? • Apparent latency • Manifestations - what organs affected • Pathogenesis - probable or known • 3 Review the literature • This is often forgotten, or under-utilized • But is essential to avoid mistakes and wasting time
3: Understanding the disease - latency and duration • Latency refers to interval between exposure and disease. • Short latency – many infectious disease • Long latency – many chronic diseases or occupational diseases • Eg., cigarette smoking and lung cancer • Asbestos and mesothelioma
Step 4a: Large Case Series • Description of a large number of patients with a new disease, or receiving a new treatment or new operation • Can help to refine case definition. • No controls or comparison population • Implicit comparison with standard, or previous therapy • Historical controls or concurrent non-randomized controls • Advantages – quick, easy and cheap • Comprehensive - Includes all cases • Disadvantages – if results appear better can not be sure it is due to: • Better results of new treatment , or, Better selection of patients • Eg: surgery for MDR-TB yields better survival than in patients who did not have surgery
Step 4b: Reported Data - a form of large case series • Reported data commonly used • (TB, HIV, Cancers) • Useful to define incidence/prevalence in a population, and trends over time. • Some risk factors can be identified, if characteristics of general population known • Description of clinical characteristics and outcomes can be useful. • Most useful if reporting is very complete.
Step 4c: Ecologic Studies General Design • Pick a condition or disease that is reported,or you have information at a group level. • Eg., cancer rates by state or city • or, Complication or mortality rates by hospital • Get info re determinants or exposures at the same group or community level • Eg Census data, Air pollution data, Climate, • Analyze association between disease or condition and exposures - both at group level
4c: Ecologic Studies Advantages • Usually very easy and quick studies • Take advantage of already reported data • And already gathered information about the populations (eg., from census) Disadvantages • Relationship may be due to completely unmeasured factors • Substantial potential for confounding
Step 5 - Directly gathering your own data: Prevalence or Analytic studies? • Prevalence surveys are the simplest to design but can be harder to conduct • Analytic - Case-control are much harder to design correctly, but can be easier to carry out • Analytic - Cohort studies - not-so-hard to design, but very hard to carry out • So, lets start with a Prevalence study
Step 5 - Prevalence or cross-sectional studies • Objectives: • Define risk factors (exposures) for disease • Also define occurrence/ importance in a population • General approach: • Pick a disease or condition (can pick several) • Identify the possible determinants or risk factors (can pick several) • Pick a population, get them to agree (one time survey) • Survey the population • Determine who has/has not the disease or condition • Identify who has/has not the possible determinants • Assess the relationship between disease presence and the determinants
5: Cross-sectional or Prevalence Studies (continued) Advantages • Good for chronic diseases (prevalence) • Good for common diseases • Also good for fairly common exposures • Allows one to measure multiple disease or conditions and multiple determinants or risk factors Disadvantages • Measurement of exposure can be difficult • Recall problems if long latency • Accuracy if changes over time (Alcohol, smoking, blood pressure) • Can not distinguish cause and effect (Tobacco Industry)
Step 6: Analytic Studies – Case Control General design • Identify a group of patients with disease, or conditions = cases • Identify similar group but without disease or conditions = controls • Measure risk factors or determinants in both • Assess if exposure more likely (odds > 1) in cases than controls
6: Case Control Studies Advantages • Relatively cheap and quick • Particularly useful for studying rare conditions • Or conditions with long latency Disadvantages • Controls, Controls, Controls • Very difficult to select proper controls • This is the source of most problems in case control studies • And is why they are generally considered weak evidence. • Difficulties of retrospective exposure assessment • particularly if long latency
Step 7: Analytic Studies – Cohorts General design • Find a group of healthy people (without condition/ disease) • Eg.: military, workforce, nurses • Measure their characteristics at baseline • Particularly exposures of interest • Follow them for a period of time • Measure occurrence of disease or condition
7: Cohort Studies Advantages • Can measure many exposures or determinants • Can measure many diseases • Much better to know cause and effect Disadvantages • Long and expensive (often very $$$) • Good for common diseases (some cancers, cardiovascular) • Inefficient for rare diseases or with long latency • Also what if you fail to measure key determinants • (Solution = freezer)
Step 7a: Studies of Diagnostic Tests General design • Usually prospective • Find group of patients with condition • Ideally when they are being investigated for it • Try new test & standard or reference tests • Establish a final accurate diagnosis in all • Need a GOLD standard. • Compare new test to old test(s) • agreement, sensitivity and specificity
7a: Diagnostic Test Studies Advantages • Relatively cheap, and quick • If condition is reasonable common Disadvantages • Must define final diagnosis correctly. Must have a gold standard • Persons doing new test must be blinded • Population must be representative • eg. Patients with advanced disease vs. healthy volunteers
The final step: Experimental Studies – Randomized Trials General Design • Pick an intervention – usually a form of treatment • You can only pick one • Find a group of patients that agree to participate • Have to be representative of condition • Give the new treatment to some • Some get the old (or no) treatment • Do this randomly • Follow all to see outcomes
Experimental Studies – Randomized Trials Advantages • Best way to evaluate effect of an intervention • Best control of bias and confounding Disadvantages • Not easy or feasible for all interventions • Not useful for studies or risk factors or natural history • Difficult to apply for most diagnostic tests • Substantial refusal or drop-out rates can restrict generalizability • Population selected may not be representative • Young healthier adults • No pregnancy, no kids, no elderly PLEASE!
Experimental Community or Field Trials General Design • Pick an intervention to be applied at a community level • Fluoride in water, public education, vaccination • Find several communities or population groups • Apply intervention to some and not others • Randomly again • Measure outcomes at population or group level
Community or Field Trials Advantages • Only way to study some interventions • May offer better assessment of likely impact of these interventions Disadvantages • All the same problems as ecologic studies • Also some important ethical issues (eg., fluoride)