Download

1 / 32
320 likes | 403 Views
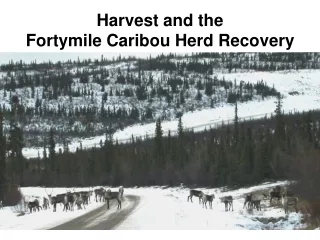
Parkside Gully Tolerant Hardwood Selection Harvest and Product Recovery Study. Bill Cole, Elaine Mallory, Jeff Kokes, Jennie Pearce. OMNR Ontario Forest Research Institute 30 April 2008. Study Location. Brief Project History. Tea Lake. Swan Lake. Hwy 60.

E N D
Parkside Gully Tolerant Hardwood Selection Harvest and Product Recovery Study Bill Cole, Elaine Mallory, Jeff Kokes, Jennie Pearce OMNR Ontario Forest Research Institute 30 April 2008
Study Location Cole/OFRI
Brief Project History Tea Lake Swan Lake Hwy 60 • 3 demonstration projects started in 1965-1967 at Swan Lake • Two stands harvested (12 ha) • Two stands uncut (12 ha) • Harvests occurred in 1967, 1980, 1992, 2005 • Data collection years: • 1965, 1966, 1967, 1968, 1974, 1976, 1978, 1980, 1981, 1984, 1987, 1990, 1992, 1993, 1997, 2005, 2006 Harvest Uncut Swan Lake Forest Research Reserve Harvest Uncut Cole/OFRI
Current Project Study objectives: • To compare growth rates and stem quality development in managed stands vs. uncut control stands over 40 years; • To compare managed and unmanaged stands after 40 years using two indicators: - downed coarse wood - understory vegetation composition; • To compare the quantity, quality and economic values of products generated from 2005 harvest to average regional yields from two perspectives: - forest land manager - forest products manufacturer. Cole/OFRI
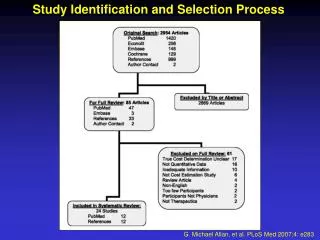
Methods We used lots of methods…including Measuring trees and stands before and after 2005 harvest Tallying and scaling logs during the December 2005 harvest Summarizing board grades and yield from the sawlogs Tracking all logs through the Huntsville sawmill Cole/OFRI
Results Cole/OFRI
Results 1967 Harvest 10.6 m2/ha 2005 Harvest 4.9 m2/ha 1980 Harvest 5.5 m2/ha 1992 Harvest 4.6 m2/ha GLSL & South. Residual BA target North Shore Residual BA target 12 yr interval 13 yr interval 13 yr interval Cole/OFRI
Results Parkside Gully - Average annual basal area growth Cole/OFRI
Results Logging Damage • Provincial logging damage standard: • 85% of residual BA ( trees > 10 cm) free from major damage • 90% of residual AGS trees free from major damage • damage not concentrated in one size class • Parkside Gully logging damage (2005 winter harvest): • 98.5% of residual basal area (trees > 10 cm dbh) free from major damage after 1992 harvest • 97.8% of residual basal area free from major damage after 2005 harvest • Woods et al. (2007) found 90.6% residual basal area free from major damage in their sampled crown land stands Cole/OFRI
Results Vegetation impacts after 40 years of single-tree selection management: • Very little difference in observed patterns of species distribution in overstory or understory • Uncut and harvested stand overstories were dominated by sugar maple and beech, with small amounts of yellow birch, hemlock, and white spruce • Tree regeneration dominated by sugar maple and beech • Scattered patches of yellow birch, white spruce, balsam fir and ironwood regeneration in both • Shrub layer dominated by hobble bush and striped maple, with small amount of mountain maple and beaked hazel Cole/OFRI
Results 40-year management impacts on snags and downed coarse wood Cole/OFRI
Methods Economic analysis – Forest manager • Parkside Gully Study assumptions and calculations • Tonnes harvested and transported to Huntsville-Tembec mill (44.4 tonnes/ha) • Calculate gross revenue for logs harvested using 2005 log prices ($) • Summarize total gross logging costs ($) • Calculate total gross logging cost ($/tonne) • Calculate total 2005 net log revenue (gross revenue – gross logging cost) ($) • Calculate net revenue per ha harvested ($/ha) Cole/OFRI
Results Economic analysis – Forest manager Cole/OFRI
Methods Economic analysis – Forest manager • Bush run assumptions and calculations • Average tonnes harvested from recent operations (50 tonnes/ha) • Multiply by Parkside Gully harvest area for comparable expected tonnes harvested • Calculate expected log yield by species and log grade using average bush run data and expected tonnes harvested • Calculate expected bush run gross revenue using estimated yield and 2005 log prices ($) • Calculate expected gross logging costs using average costs and expected tonnes harvested ($/tonne) • Calculate expected net revenue for 2005 bush run harvest ($) • Calculate expected net revenue per ha harvested ($/ha) Cole/OFRI
Results Economic analysis – Forest manager Cole/OFRI
Results Economic analysis – Forest manager Cole/OFRI
Results Economic values – Forest manager Cole/OFRI
Methods Economic analysis – Forest manager • Many (but not all) natural resource economists assume that $100 in hand today is worth more than $100 expected to be received in the future • To compare equivalent value of benefits in one year with those in a future year, a discount rate is applied to the future expected dollar value when estimating its net present value (NPV):NPVbase yr = (future value) , where (1+DR)yDR = discount rate, usually 0 < DR < .10y = (future year) – (base year), ornumber of years over which the discount is calculated Cole/OFRI
Option 1 Option 2 Option 3 Results Economic analysis – Forest manager Economic analysis question: • What is the expected net present value (NPV2005) of the Parkside Gully harvests vs. average bush-run harvests over 26 years ($/ha)? • But for which 26 year harvest cycle? Cole/OFRI
$3133 $2777 $2216 $636 $636 $636 Results Economic analysis – Forest manager Δ = 3.4 - 4.9x Cole/OFRI
$3133 $2145 $ 920 $636 $380 $110 Results Economic analysis – Forest manager Δ =4.9 - 8.4x Cole/OFRI
Methods Economic analysis – Mill manager • Mill analysis assumptions and calculations • Observed actual Parkside Gully product yield for maple and beech, based on 407 tonnes processed at Tembec-Huntsville • Value ($/FBM) for each product class from February 2006 mill prices • Sawlog costs at mill gate to forest manager (pulpwood costs and revenues not included in mill analysis) • Net revenue for logs sawn from Parkside Gully harvest (excl. other mill costs, e.g., depreciation, energy, labour) • Net revenue per tonne processed Cole/OFRI
Methods Economic analysis – Mill manager • Mill analysis assumptions and calculations • Estimated equivalent bush run product yield for maple and beech, based on same tonnage used to calculate log costs (220 tonnes) • Value ($/FBM) for each product class from February 2006 mill prices • Sawlog costs at mill gate to forest manager (estimated for bush run) • Pulpwood costs and revenues not included in mill analysis • Net revenue and net revenue per tonne processed Cole/OFRI
Results Economic analysis – Mill manager Cole/OFRI
Conclusions Productive site with little or no high-grading history Provincial single-tree selection management guidelines, marking for quality improvement using careful logging Periodic annual increment (0.38-0.47 m2/ha/yr) as expected from silviculture guide and some Ontario field studies (e.g., Stokes study); Not extreme or unrealistic We have sustainable basal area growth with commercial harvest every 12-13 years over 40 years, although may not be practical for all sites or stands Cole/OFRI
Conclusions After 4 cuts stands are approaching but have not quite reached desired diameter/basal area structure – (still a bit understocked in high-quality small sawlogs) Minimal impacts detected on overstory and understory woody species composition Snags in harvested stands had smaller diameter and lower density (#/ha) than uncut controls Downed coarse wood in harvested stands had similar number of pieces as uncut stands (#/ha), but smaller diameter and lower volume than uncut control stands Cole/OFRI
Conclusions Forest land manager yielded ~ 3.4 – 8.4x net revenue from well-managed high-quality hardwood stand compared to current average crown land over 26 year management cycle, depending on economic assumptions made. Forest mill manager yielded ~ 1.2x net revenue in sawn boards from high-quality Parkside Gully harvest compared to typical bush run (conservative – no veneer from Parkside Gully) Cole/OFRI
Closing thoughts • Careful long-term tolerant hardwood silviculture on good sites pays! • If you have good quality within stands, try to protect or improve it. • Through policy, guidelines, practices, and science transfer, we should be encouraging tolerant hardwood management on 15-20 year re-entry cycles, not accepting 25+ yrs as the norm. • Contact OFRI or the Forestry Research Partnership to arrange a tour of the Parkside Gully study area. Cole/OFRI
Acknowledgements Thanks to • Living Legacy Research Program • Enhanced Forest Productivity Program • Forestry Research Partnership – Al Stinson, Nancy Young • Algonquin Provincial Park – Jim Murphy, Brad Steinberg, Joe Yaraskavitch, John Swick • Algonquin Forestry Authority – Bill Hubbert • Tembec-Huntsville – Gerald Kroes, Alex Encil • Southern Science and Information staff - Murray Woods, Wayne Reid, George Sanshagrin, Johnny Belanger, Andrea Knapp • Harvey Anderson, Elaine Mallory, Jeff Kokes, Jim Rice, Randy Fawcett • Al Corlett, Margaret Penner, Tony Kennedy, Marvin Chartrand Cole/OFRI
Thank you Cole/OFRI
Results Basal area by diameter class & basal area growth Cole/OFRI
Results Cole/OFRI