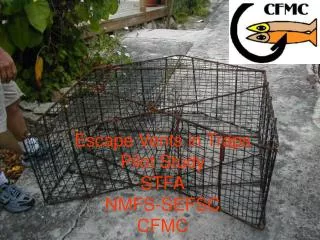
STFA/SCCFA/CFMC Spiny Lobster Project
340 likes | 543 Views
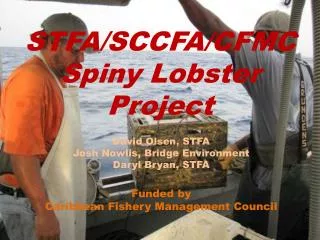
STFA/SCCFA/CFMC Spiny Lobster Project. David Olsen, STFA Josh Nowlis, Bridge Environment Daryl Bryan, STFA Funded by Caribbean Fishery Management Council. Virgin Islands Spiny Lobster Landings. Landings by Method. # Lobster Trips by Island (1974-2006). Tags and Recaptures.

STFA/SCCFA/CFMC Spiny Lobster Project
E N D
Presentation Transcript
STFA/SCCFA/CFMCSpiny Lobster Project David Olsen, STFA Josh Nowlis, Bridge Environment Daryl Bryan, STFA Funded by Caribbean Fishery Management Council
% of Lobster by CL (Complete Trips) Minimum Legal CL
Recruitment Pulse?St. Thomas/St. John Size Class Frequencies
Summary of Coral World Tag Retention Study • 45 lobsters were installed at Coral World between July and October 2013. To date there have been 9 molts with no tag loss. • In the mean-time we have tagged an additional 10 (<45 mm) small Coral World lobsters. 6 of these molted and 4 lost their tags. • The smallest lobster tagged in the field was 51 mm CL. • We do not think tag loss is much of an issue.
Mortality Calculation • Von Bertalanffy growth equation . • Solve for (t) for carapace length. • This provides the age for each size class in the size frequency distribution so that total mortality (Z) can be calculated as the difference in numbers from the size class bin at full recruitment and the size class bin containing L Where: is the number of fish at time (t) and (t-1)andZ is the rate of total mortality.
Estimated Spiny Lobster Growth L∞ =244.9 mm K=0.361 W∞ =15.6 lbs
Comparison Between Annual Fish Trap Hauls(St. Thomas CCR Reports and Fishermen Interviews)
Traps/Day Hauled in St. Thomas (TIP, Historic and Adjusted CCR Data Compared to Current SEFSC Data)
Summary of Status: St. Thomas • On St. Thomas, landings increased gradually from the mid-1980s to peaks of just over 136,000 lbs in 2003 through 2006, followed by decreased landings following this period. • During this time of historically high catches, the stock showed no consistent signs of decline in catch per unit effort or in the average size of catch. • The average size of catch itself remained well above the minimum size limit and the size at first maturity. • As such, catches of 130,000 lbs a year appear to be sustainable. Current OFL is 115,776 lbs. • Ongoing catch reporting and port sampling allow us to watch for future signs of overfishing, and would allow for the opportunity to adjust catches downward if necessary.
Summary of Status: St. Croix • On St. Croix, landings grew dramatically starting in the mid-1990s to a peak of over 155,000 lbs in 2008. Catches have exceeded 135,000 lbs most years since 2005 to 2011 • Indicators of health provide conflicting information. Whereas catch per unit effort has consistently increased since 2003, the average size of catch has mostly declined since 2007, with particularly dramatic drops in 2011 and 2012. The Carapace Length value in 2012 was close to the minimum size limit and size at first maturity, indicating lobster were being caught just as they grew to legal size and were capable of contributing new lobsters to the population. • Given the data sources (port sampling versus self-reporting) and problems with assessing diving effort, the size information should probably receive greater consideration than catch per unit effort. • While the size information is no guarantee that the stock is in poor condition, it does raise concerns about the current catch levels. • Catches of 100,000 to 120,000 lbs were sustained in the early 2000s and may be a suitable quota, pending ongoing monitoring of this stock. Current OFL is 119,230 lbs.