HunchLab: Crime Density Insights & Notifications for Law Enforcement
220 likes | 318 Views
HunchLab offers a new way to analyze and track changes in crime density, with notifications and data visualization solutions, helping law enforcement make informed decisions. Explore crime classifications and incidents data in a dynamic platform. Gain insights and respond strategically to evolving crime patterns.

HunchLab: Crime Density Insights & Notifications for Law Enforcement
E N D
Presentation Transcript
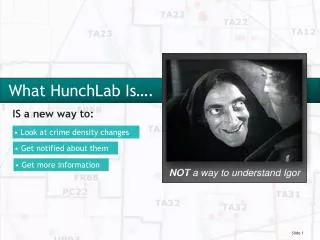
What HunchLab Is…. IS a new way to: • Look at crime density changes • Get notified about them • Get more information NOT a way to understand Igor
A Visualization Solution Becomes a Problem • 1.5 million incidents per year • Around 40 crime classifications • Approximately 6900 sworn officers
A Classic Problem – The “Data Tornado” By Golly Toto, it’s a twister!
Where Do They Clump? From http://data.baltimoresun.com/crime/anne_arundel/accident-person-injured/?mode=heat (not HunchLab)
What We Really Want to Know – How are the Densities CHANGING? ? Crimes 8/23/2008 – 8/30/2008 Crimes 8/16/2008 – 8/22/2008
How Do We Figure out Density Change? • Take an area or *many* areas to evaluate • Use statistics to compare historical norms to current densities • But… how? • Call crimes balls in a bag.
That’s Right, Balls In a Bag That’s Right, Balls in a Bag A bag has 20 black balls and 80 white balls. Choose 5 at random. What is the chance of getting 3 black balls? Vary number of balls chosen and you get a Hypergeometric Distribution
Crimes -> Balls -> Probabilities Crimes è Balls è Probabilities
Lather, Rinse, Repeat Lather, Rinse, Repeat
Using HunchLab – Graphing Sixteen you say? By Jove!
Using HunchLab – Drill Down 7001 Bridgeport Wy W? Of Course!
Using HunchLab – Hunch Creation Our villain is probably active here too! Let’s check…
Using HunchLab – Search You’ve been working hard Watson…
Future… Thanks to Andy Warhol