Download
1 / 15
150 likes | 261 Views
Observed Trends in Northeast Brazil Mean and Extreme Precipitation. Brant Liebmann NOAA Earth System Research Laboratory and University of Colorado Boulder, Colorado, USA Leila M. V. Carvalho University of California at Santa Barbara Ileana Bladé

E N D
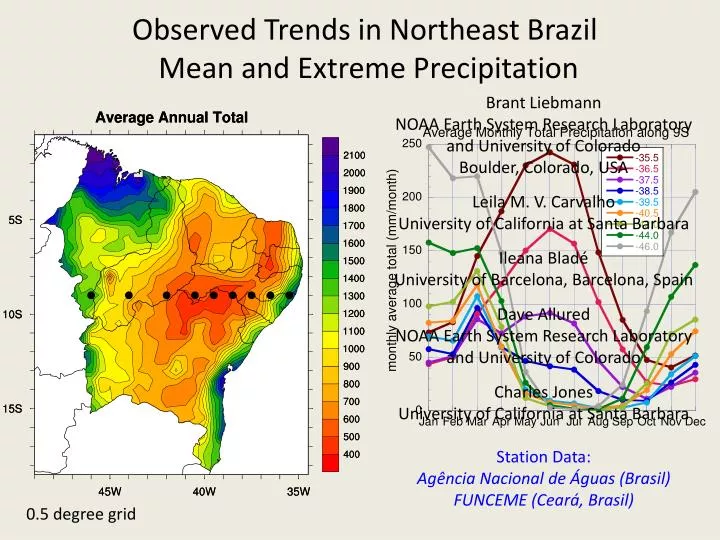
Observed Trends in Northeast Brazil Mean and Extreme Precipitation Brant Liebmann NOAA Earth System Research Laboratory and University of Colorado Boulder, Colorado, USA Leila M. V. Carvalho University of California at Santa Barbara Ileana Bladé University of Barcelona, Barcelona, Spain Dave Allured NOAA Earth System Research Laboratory and University of Colorado Charles Jones University of California at Santa Barbara Station Data: AgênciaNacional de Águas (Brasil) FUNCEME (Ceará, Brasil) 0.5 degree grid
0.5 degree grid 1.0 degree grid (mm/length)
Changes in Daily Extreme Events • Most previous studies have used arbitrary threshold • to define extreme daily value (e.g., 95th percentile) - Does not weigh huge event more than one barely above threshold In present study, we compute a time series of daily squared values from gridded data (not variance) Advantages: - Threshold for ‘extreme’ is not arbitrary - Weighting increases for larger values Problems: - Not clear whether squared value is appropriate amplifier - Sensitive to errors in data, particularly accumulated values
Summary • Annual Average Precipitation Varies by a Factor of 5 Across Northeast Brazil • Most of Domain Has Summer Maximum; East Coast Maximum in Winter • Trends Are Sensitive to Range of Dates Used in Calculation • Index Computed of Squared Daily Values in Order to Emphasize Large Events • Often, Changes in Squares Mimic Changes in Mean • In Some Locations, Mean Precipitation has Decreased While ‘Extremes’ • have Increased