Download
1 / 31
330 likes | 550 Views
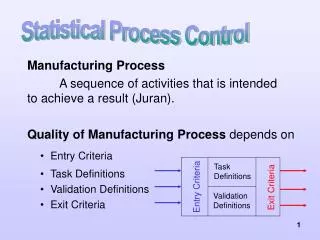
Manufacturing Process A sequence of activities that is intended to achieve a result (Juran). Quality of Manufacturing Process depends on Entry Criteria Task Definitions Validation Definitions Exit Criteria. Task Definitions. Entry Criteria. Exit Criteria. Validation Definitions.

E N D
ManufacturingProcess A sequence of activities that is intended to achieve a result (Juran). Quality of Manufacturing Process depends on Entry Criteria Task Definitions Validation Definitions Exit Criteria Task Definitions Entry Criteria Exit Criteria Validation Definitions Statistical Process Control
Variation of ProcessQuality Outcomes of the process vary along the process life. The variation should follow a Normal Distribution with a level of acceptable dispersion. Causes of Variation Common Causes (Natural variation) Small, random forces that act continuously on the process. Special Causes (Assignable variation) Extraneous to the process and interfere with the routine operation and normal dynamics of the process. Process Variation
Average ? Standard Deviation ? Variance? Design tolerance *Allowed tolerance* is not equal to Design tolerance Process Variation (1) Spec Width? Allowed tolerance Allowed tolerance Ideal specification
Average ? Standard Deviation ? Variance? Design tolerance *Allowed tolerance* is not equal to Design tolerance Process Variation (2) Allowed tolerance Allowed tolerance Ideal specification
Objective To determine whether a process is staying in control or is potentially moving out of control at a given point of time -- Process Monitoring SPC Procedure Periodically select a sample of items, inspect and note the result Determine a type of variation cause related to the result Take remedy actions, relevant to sources of variation Statistical Process Control
Measures of Central Tendency Measures of Dispersion Population Distribution Sampling Distribution Central Limit Theorem Normal Distribution (Average, Standard Deviation) Standardized Normal Distribution; Z (0,1) Level of Confidence Interval Statistical Concepts
Data Collection and Plotting points Sampling Distribution Central Limit Theorem Control Limits Randomness Positions of Upper and Lower Control Limits Concept Calculations Control Limits Adjustment Significant change of the process Signals of going “out of control” Risks of Error: Type I error & Type II error SPC by Control Charts
Variables Charts X-bar Charts R Charts Attributes Charts • P Chart • C Chart What are Attributes Measurement in a process ? Types & Uses of Control Charts What are Variables Measurement in a process ?
X-bar Charts To monitor process central tendency based on estimated process mean R Charts To monitor process variability based on estimated process range Control Chart for Variables
P Chart To monitor proportion or fraction of process in a category C Chart To monitor count, or number of occurrences Control Charts for Attributes
original process a change in process mean a change in process variation a change in both mean & variation Process Parameters and "Control Limit" Positioning UCL CL LCL Back to 25
Center line, CL = Average of Sample Averages, For 3-Sigma* limits, X bar, sampling average R R Upper Control Limit, UCL Center Line, CL Lower Control Limit, LCL X X X UCL = + A2 LCL = - A2 Sigma* = sigma of sampling distribution X-bar Chart Table 14.4 Control Chart Constants
Center line, CL = Average of Sample Ranges, For 3-Sigma* limits, R, sampling range R R R Upper Control Limit, UCL Center Line, CL Lower Control Limit, LCL UCL = D4 LCL = D3 Sigma* = sigma of sampling distribution R Chart Table 14.4 Control Chart Constants
Control Chart Constants Sample Size(n) A2 D3 D4 3 1.023 0 2.575 4 0.729 0 2.282 5 0.577 0 2.114 … 10 0.308 0.223 1.777 …
Center line, CL = Average of Sample proportion, For 3-Sigma* limits, Fraction defective, p Upper Control Limit, UCLp UCL = + 3 Lower Control Limit, LCLp p p p p p p p (1- ) (1- ) n n LCL = - 3 Sigma* = sigma of sampling distribution P Chart Center Line, p bar
Center line, CL = Average number of characteristics, For 3-Sigma* limits, Number of defective, c Upper Control Limit, UCLc Center Line, c bar Lower Control Limit, LCLc c c c c c UCL = + 3 LCL = - 3 Sigma* = sigma of sampling distribution C Chart
To get Estimated process parameters : 1) How do we know the estimators are good enough? 2) How many samples should we need, and How many groups of them? 3) What factors do we consider? X R c p Let’s discuss this !!
Sampling Basis: Concept of Rational sampling Homogenous items(Within-Groups and Among-Groups variations) Time-order Consecutive items Time-order Distributed items Sample Size: -- The most common “n” is 5 -- Large enough “n” to detect a defect count X R c p Sampling Issues (1)
Sampling Frequency Depends on the nature of process and Opportunity of assignable variation exposure Initial Number of Samples, m To make sure that we are observing a stable process, practically 20, or 30, 40 of “m” should be located within Control Limits. Sampling Issues (2)
Easiness Efforts Costs Usefulness Value of obtained information Company image Attribute Charts VS Variable Charts Then, which one we select, and Why So?
A point lies outside the control limits Any 2 of 3 consecutive points fall in the same A zone 4 out of 5 consecutive points fall in the same B zone 8 or more consecutive points lie on the same side of CL 8 or more consecutive points move continuously in the same direction either upward or downward Zone A Zone B Zone B Zone A Sigma* = sigma of sampling distribution "Out of Control" Signals Parameter UCL (3 Sigma*) 2 Sigma* 1 Sigma* CL 1 Sigma* 2 Sigma* LCL (3 Sigma*)
Definition of a Stable Process Uses of Control Charts Variable Charts Attributes Charts Control Chart Restructuring: Why & When? Pre-Control Process Capability Study Process Improvement Process Stability
X Red Zone USL Yellow Zone Target, CL LSL Yellow Zone Red Zone Pre-Control GREEN ZONE Initial Set-up: All 5 consecutive items must fall in Green zone Periodically check: 2 items at a time
Process Stability (2) Quiz !?! To See No. 10
Run Diagram VS Control Charts Specifications VS Control Limits Customer spec. Design spec. Detection VS Prevention Approach Points of control Rapid feedback system “Quality cannot be inspected into products” Cautions!! Value of information?
Inspection and Measurement errors Human Error Instrument Error: Standard & Calibration Management & Shop-floor Responsibility Cautions!!
In Control Out of Control IDEAL Capable Not Capable Process Control VS Process Capability
Conformity of outputs Process Capability Index The range over which the natural variation of a process occurs as determined by the system of common causes, i.e., “what the process can achieve under stable conditions” Quality Assurance and Acceptance Sampling A method of measuring random samples of lots or batches of products against predetermined standards Risks of Error: Producer’s Risk VS Consumer’s Risk Process Capability Study
Techniques Failure Mode and Effects Analysis (FMEA) Identification of all the ways in which a failure can occur, its effect and seriousness estimation as well as corrective actions recommendation Experimental Design or Design of Experiments (DOE) Further study on Multi-Analysis of Variance (MANOVA) Taguchi Loss Function Tolerance Design: The larger deviation from target the increasingly larger losses incurred from variation allowed Process Improvement
SPC TQC CWQC TQM Process Improvement Management Frameworks • Feigenbaum: SPC & Total Quality Control • Deming and Total Quality Management (TQM) • ISO 9000 • Six Sigma: Commitment of 3.4 ppm defect